Home /
Expert Answers /
Statistics and Probability /
b-the-table-below-shows-some-of-the-relative-frequencies-of-student-respons-pa592
(Solved): (b) The table below shows some of the relative frequencies of student respons ...

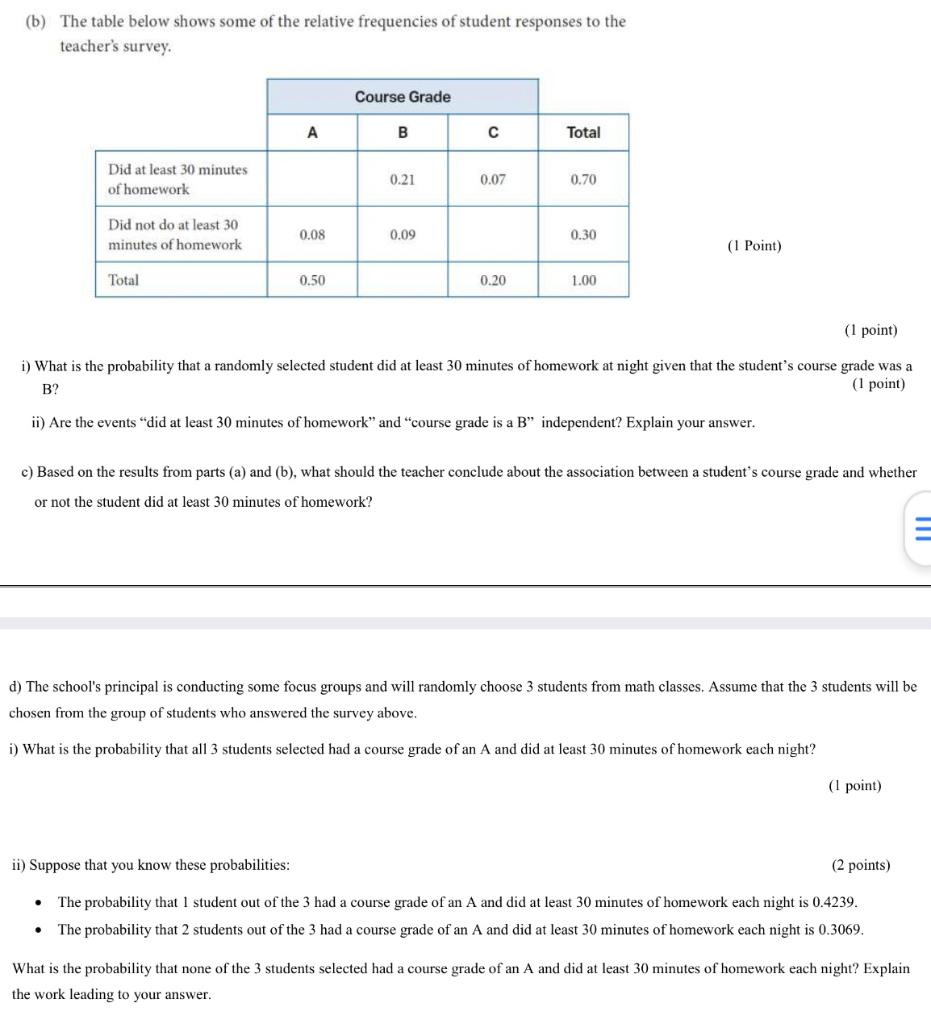
(b) The table below shows some of the relative frequencies of student responses to the teacher's survey. (1 Point) i) What is the probability that a randomly selected student did at least 30 minutes of homework at night given that the student's course grade was a B? ( 1 point) ii) Are the events "did at least 30 minutes of homework" and "course grade is a B" independent? Explain your answer. c) Based on the results from parts (a) and (b), what should the teacher conclude about the association between a student's course grade and whether or not the student did at least 30 minutes of homework? d) The school's principal is conducting some focus groups and will randomly choose 3 students from math classes. Assume that the 3 students will be chosen from the group of students who answered the survey above. i) What is the probability that all 3 students selected had a course grade of an A and did at least 30 minutes of homework each night? point) ii) Suppose that you know these probabilities: (2 points) - The probability that 1 student out of the 3 had a course grade of an A and did at least 30 minutes of homework each night is . - The probability that 2 students out of the 3 had a course grade of an A and did at least 30 minutes of homework each night is . What is the probability that none of the 3 students selected had a course grade of an A and did at least 30 minutes of homework each night? Explain the work leading to your answer.
Expert Answer
(b) i) To find the probability that a randomly selected student did at least 30 minutes of homework at night given that the student's course grade was