Home /
Expert Answers /
Statistics and Probability /
b-plot-the-points-and-graph-the-line-as-a-check-on-your-calculations-c-calculate-s-2d-find-a-95-pa601
(Solved): b) Plot the points and graph the line as a check on your calculations.c) Calculate S^2d) Find a 95% ...
b) Plot the points and graph the line as a check on your calculations.
c) Calculate S^2
d) Find a 95% confidence interval for the mean potency of a 1-ounce portion of antibiotic
stored at 65°F.
e) Find a 95% prediction interval for the potency of a 1-ounce portion of antibiotic stored at
65°F. Compare this interval to that calculated in Part d)
Please answer all parts and show steps. Thank you.
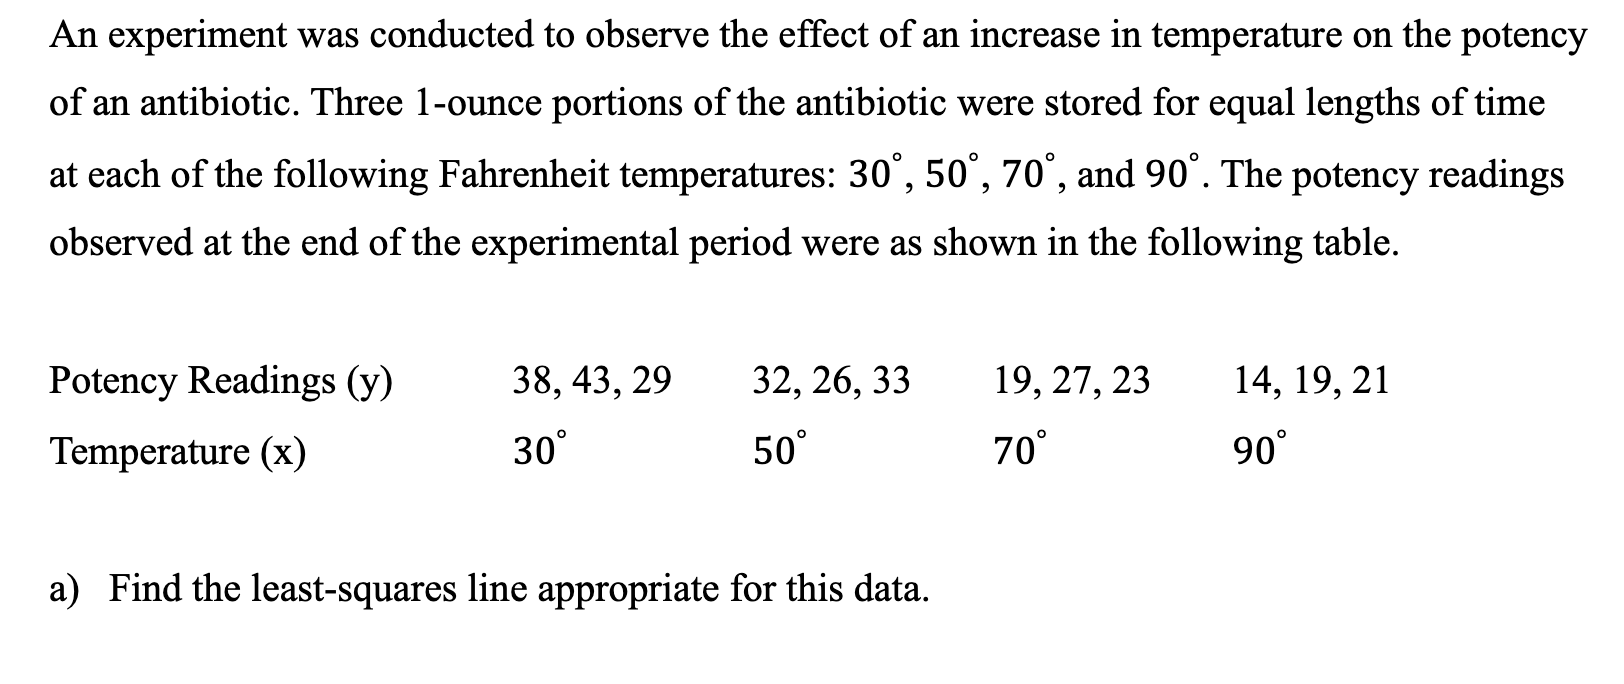
An experiment was conducted to observe the effect of an increase in temperature on the potency of an antibiotic. Three 1-ounce portions of the antibiotic were stored for equal lengths of time at each of the following Fahrenheit temperatures: , and . The potency readings observed at the end of the experimental period were as shown in the following table. a) Find the least-squares line appropriate for this data.