Home /
Expert Answers /
Statistics and Probability /
b-jose-looked-at-the-raw-data-and-discovered-that-the-54-data-values-included-both-the-city-and-hi-pa999
(Solved): (b) Jose looked at the raw data and discovered that the 54 data values included both the city and hi ...
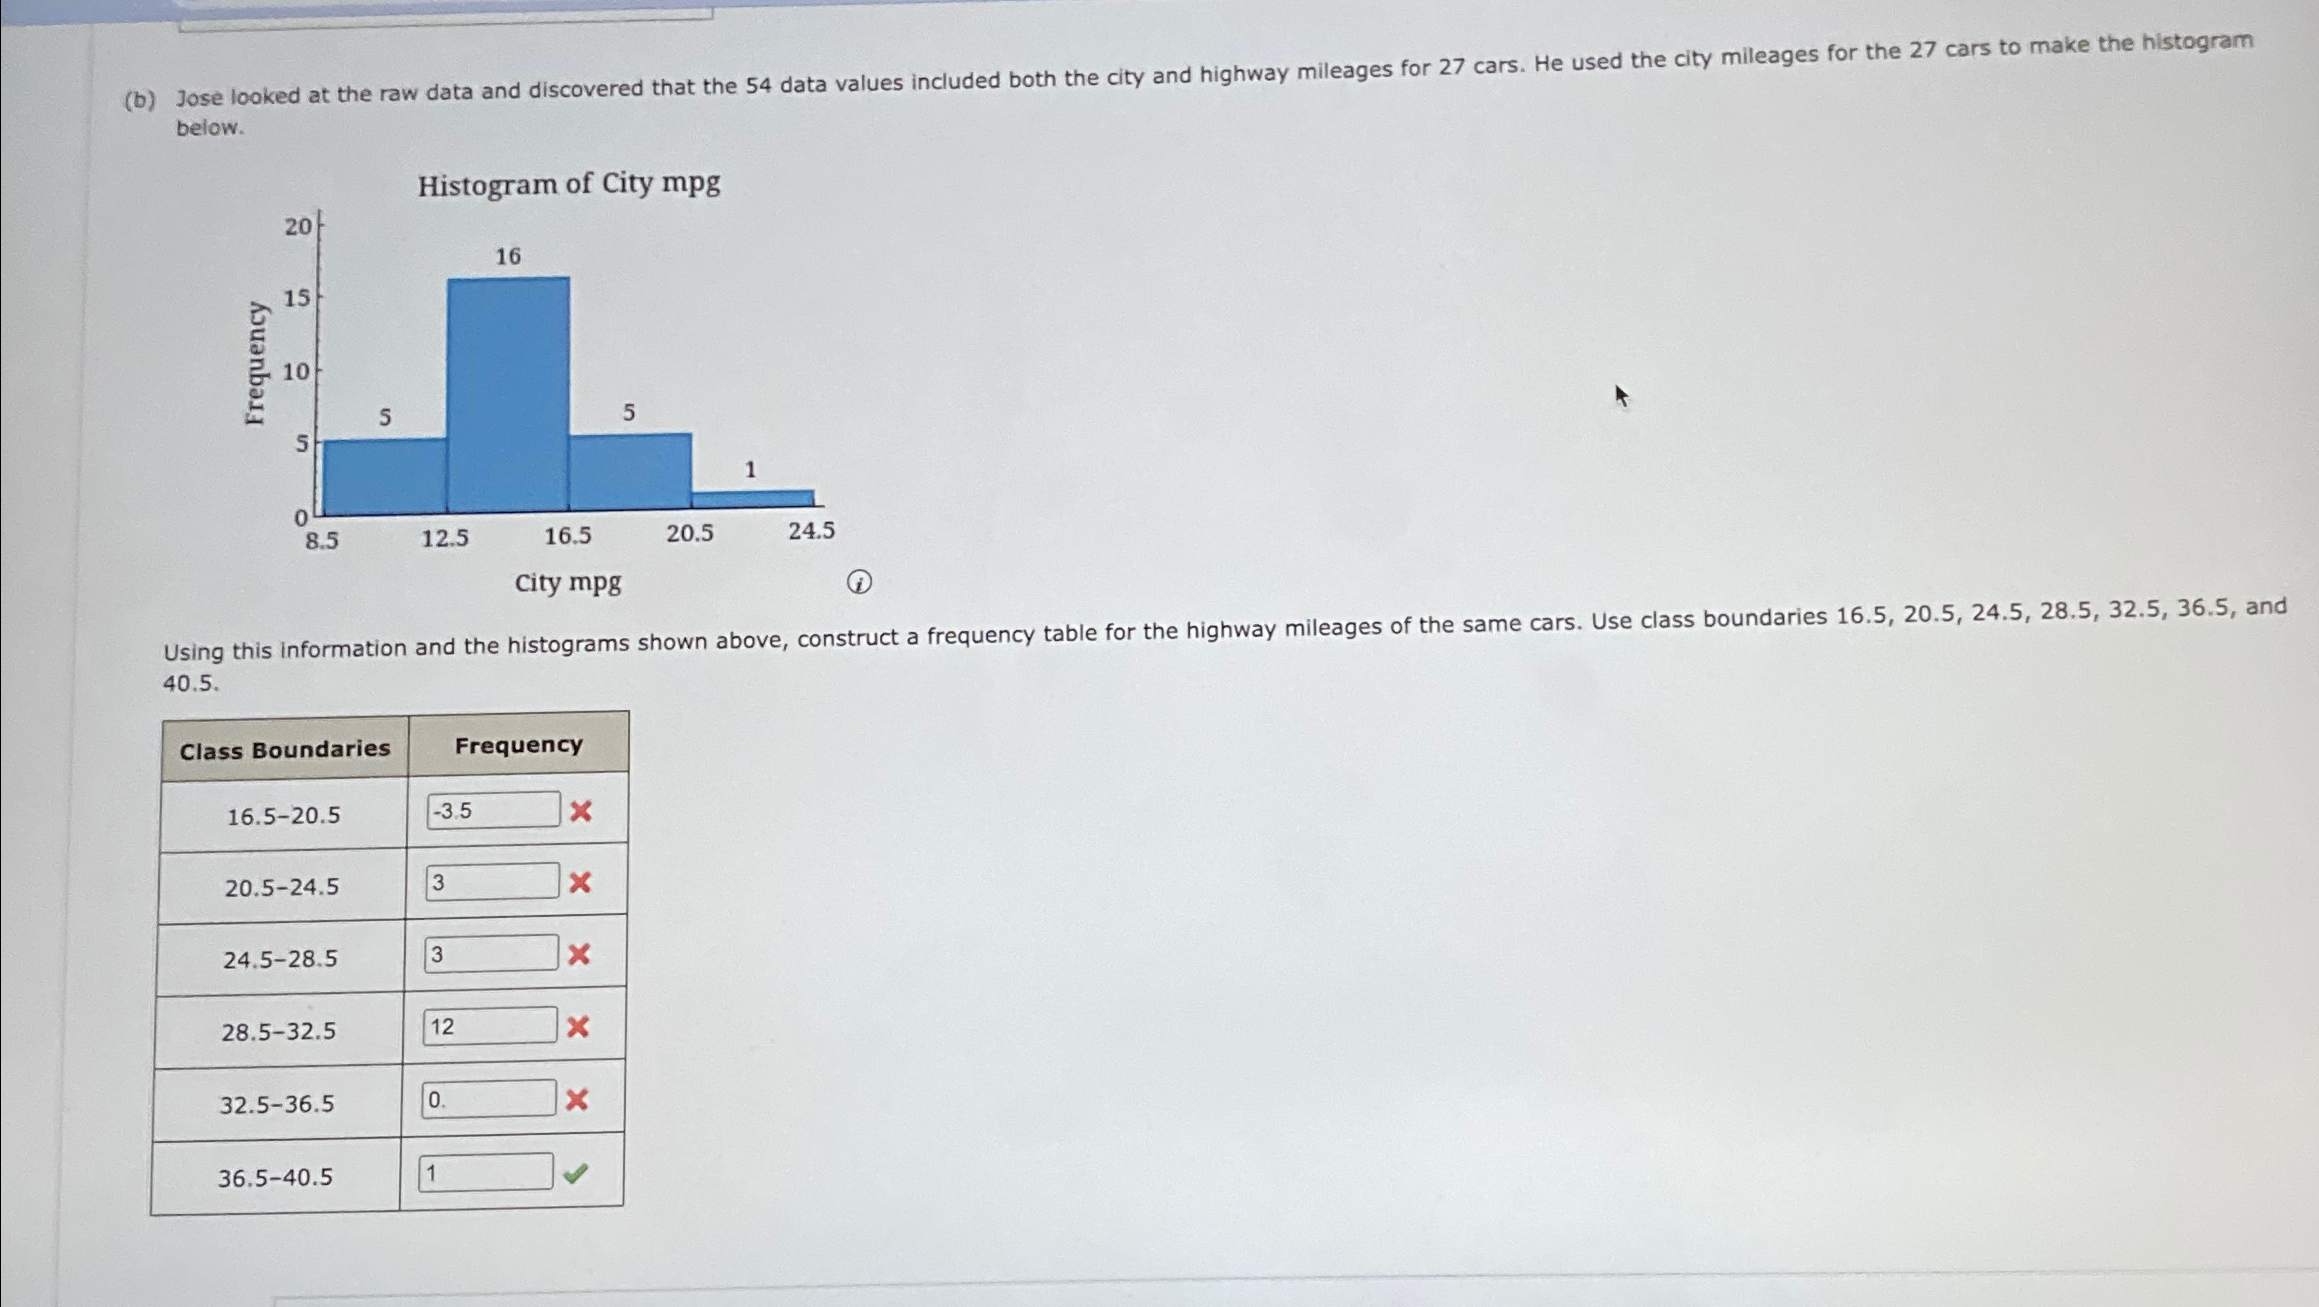
(b) Jose looked at the raw data and discovered that the 54 data values included both the city and highway mileages for 27 cars. He used the city mileages for the 27 cars to make the histogram below. Using this information and the histograms shown above, construct a frequency table for the highway mileages of the same cars. Use class boundaries
16.5,20.5,24.5,28.5,32.5,36.5, and 40.5 . \table[[Class Boundaries,Frequency],[
16.5-20.5,
\times