Home /
Expert Answers /
Chemistry /
asap-computational-analysis-using-excel-preliminary-information-this-spreadsheet-relates-to-the-b-pa215
(Solved): ASAP Computational Analysis Using Excel Preliminary Information: This spreadsheet relates to the b ...
ASAP
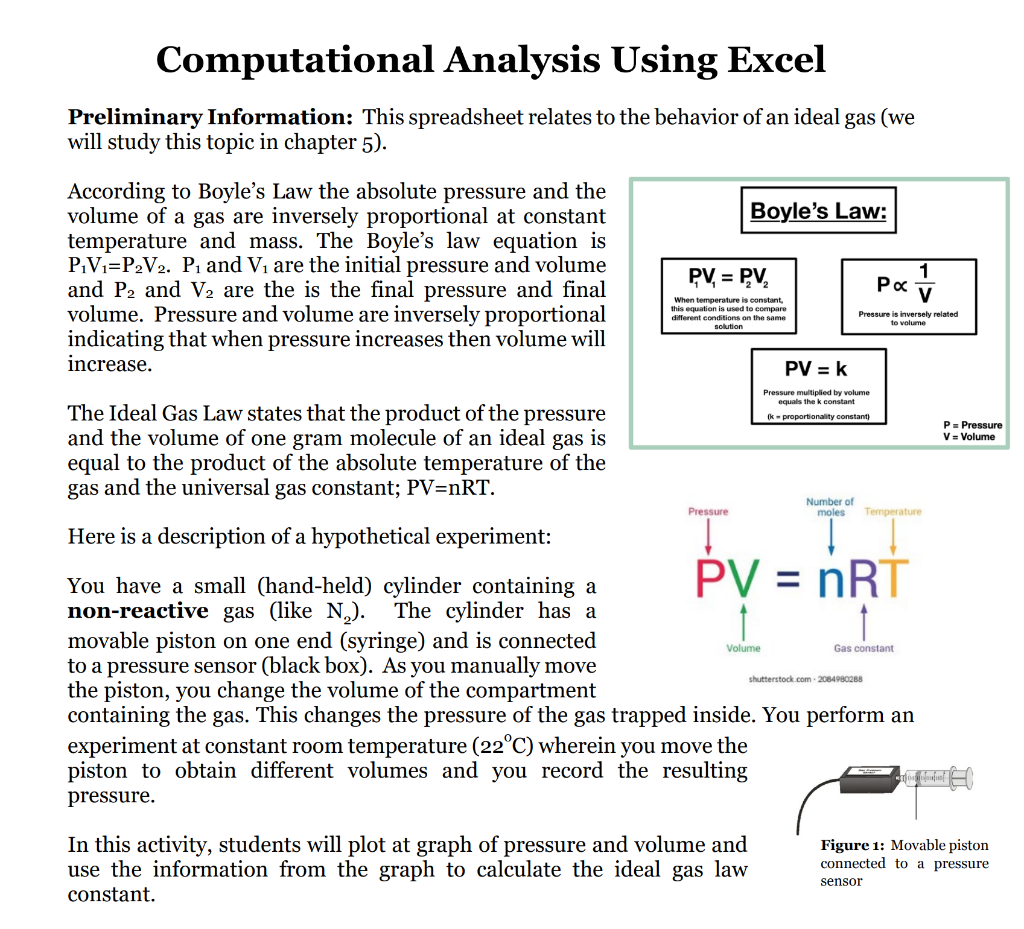
Computational Analysis Using Excel Preliminary Information: This spreadsheet relates to the behavior of an ideal gas (we will study this topic in chapter 5 ). According to Boyle's Law the absolute pressure and the volume of a gas are inversely proportional at constant temperature and mass. The Boyle's law equation is \( \mathrm{P}_{1} \mathrm{~V}_{1}=\mathrm{P}_{2} \mathrm{~V}_{2} . \mathrm{P}_{1} \) and \( \mathrm{V}_{1} \) are the initial pressure and volume and \( \mathrm{P}_{2} \) and \( \mathrm{V}_{2} \) are the is the final pressure and final indicating that when pressure increases then volume will increase. The Ideal Gas Law states that the product of the pressure and the volume of one gram molecule of an ideal gas is equal to the product of the absolute temperature of the gas and the universal gas constant; \( \mathrm{PV}=\mathrm{nRT} \). Here is a description of a hypothetical experiment: You have a small (hand-held) cylinder containing a non-reactive gas (like \( \mathrm{N}_{2} \) ). The cylinder has a movable piston on one end (syringe) and is connected to a pressure sensor (black box). As you manually move the piston, you change the volume of the compartment containing the gas. This changes the pressure of the gas trapped inside. You perform an experiment at constant room temperature \( \left(22^{\circ} \mathrm{C}\right) \) wherein you move the piston to obtain different volumes and you record the resulting pressure. In this activity, students will plot at graph of pressure and volume and use the information from the graph to calculate the ideal gas law constant.
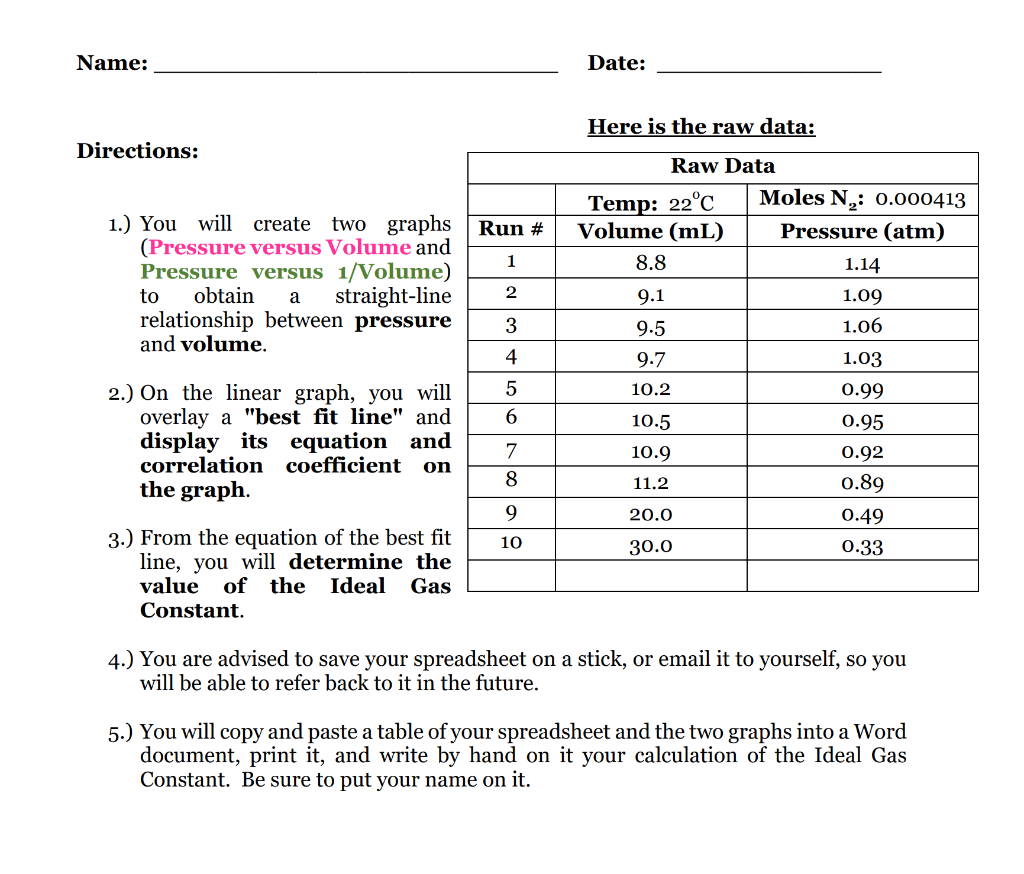
Here is the raw data: 1.) You will create two graphs (Pressure versus Volume and Pressure versus 1/Volume) to obtain a straight-line relationship between pressure and volume. 2.) On the linear graph, you will overlay a "best fit line" and display its equation and correlation coefficient on the graph. 3.) From the equation of the best fit line, you will determine the value of the Ideal Gas Constant. 4.) You are advised to save your spreadsheet on a stick, or email it to yourself, so you will be able to refer back to it in the future. 5.) You will copy and paste a table of your spreadsheet and the two graphs into a Word document, print it, and write by hand on it your calculation of the Ideal Gas Constant. Be sure to put your name on it.
Expert Answer
the plot of P vs V is shown below with the data points V(ml) P(atm) 8.8 1.14 9.1 1.09 9.5 1.06 9.7 1.03 10.2 0.99 10.5 0.95 10.9 0.