Home /
Expert Answers /
Economics /
as-shown-in-the-table-below-the-calculated-rate-of-inflation-for-year-3-is-closest-to-select-pa763
(Solved): As shown in the table below, the calculated rate of inflation for Year 3 is closest to..... Select ...
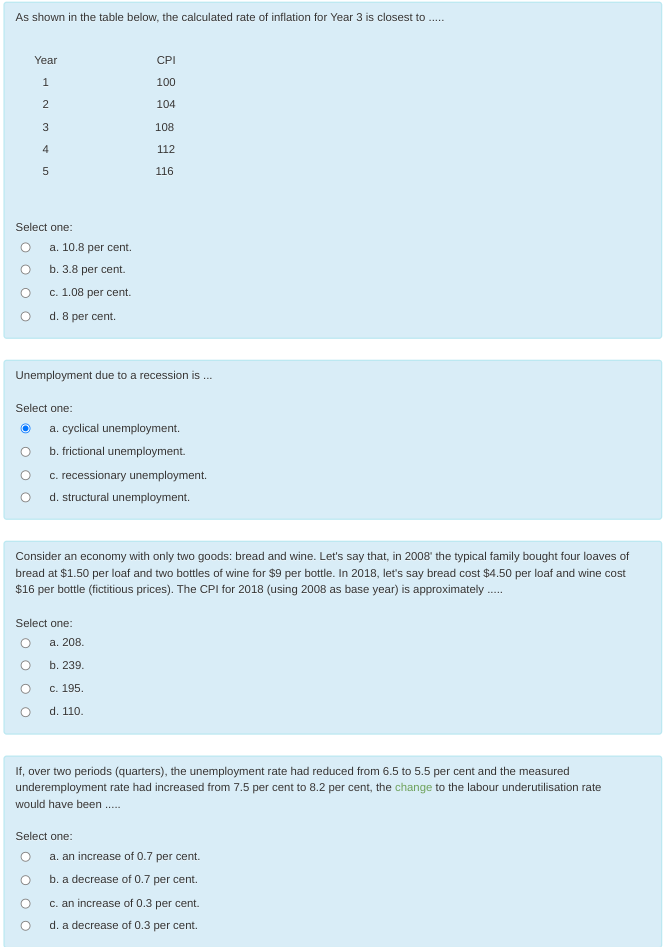
As shown in the table below, the calculated rate of inflation for Year 3 is closest to..... Select one: a. \( 10.8 \) per cent. b. \( 3.8 \) per cent. c. \( 1.08 \) per cent. d. 8 per cent. Unemployment due to a recession is ... Select one: a. cyclical unemployment. b. frictional unemployment. c. recessionary unemployment. d. structural unemployment. Consider an economy with only two goods: bread and wine. Let's say that, in 2008' the typical family bought four loaves of bread at \( \$ 1.50 \) per loaf and two bottles of wine for \( \$ 9 \) per bottle. In 2018, let's say bread cost \( \$ 4.50 \) per loaf and wine cost \( \$ 16 \) per bottle (fictitious prices). The CPI for 2018 (using 2008 as base year) is approximately ..... Select one: a. 208 . b. 239 . c. 195 . d. 110 . If, over two periods (quarters), the unemployment rate had reduced from \( 6.5 \) to \( 5.5 \) per cent and the measured underemployment rate had increased from \( 7.5 \) per cent to \( 8.2 \) per cent, the change to the labour underutilisation rate would have been ..... Select one: a. an increase of \( 0.7 \) per cent. b. a decrease of \( 0.7 \) per cent. c. an increase of \( 0.3 \) per cent. d. a decrease of \( 0.3 \) per cent.
Expert Answer
Note: "As per the Chegg policy, in case of multiple questions, only the