Home /
Expert Answers /
Economics /
above-figure-shows-cost-and-demand-curves-facing-a-profit-maximizing-perfectly-competitive-firm-pa268
(Solved): Above figure shows cost and demand curves facing a profit-maximizing, perfectly competitive firm. ...
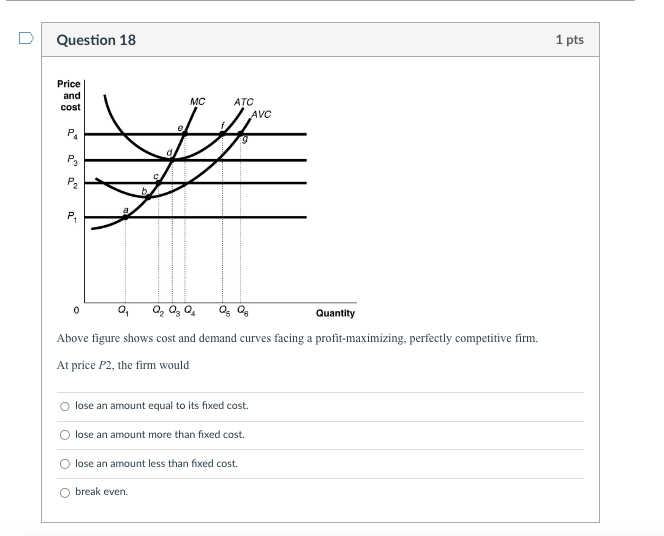
Above figure shows cost and demand curves facing a profit-maximizing, perfectly competitive firm. At price \( P 2 \), the firm would lose an amount equal to its fixed cost. lose an amount more than fixed cost. lose an amount less than fixed cost. break even.
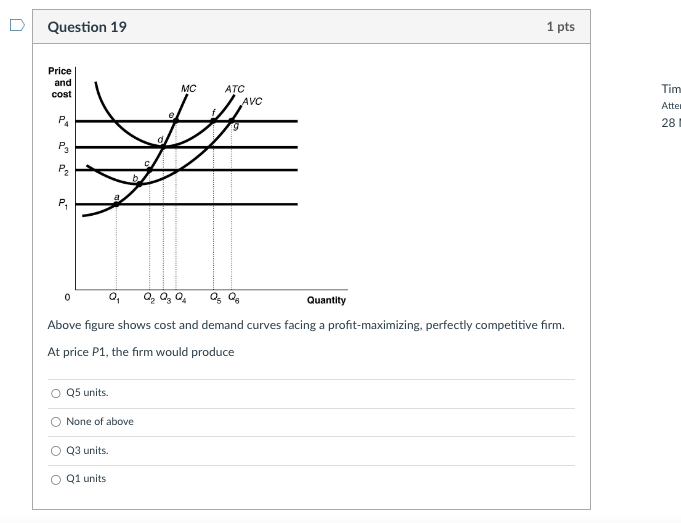
Above figure shows cost and demand curves facing a profit-maximizing, perfectly competitive firm. At price \( P 1 \), the firm would produce Q5 units. None of above Q3 units. Q1 units
Expert Answer
Lose an amount less than the fixed cost. When P= P2, it above the