(Solved): A thorough Analysis of the beer game data Interpretation of the beer game (See Data in Excel File) A ...
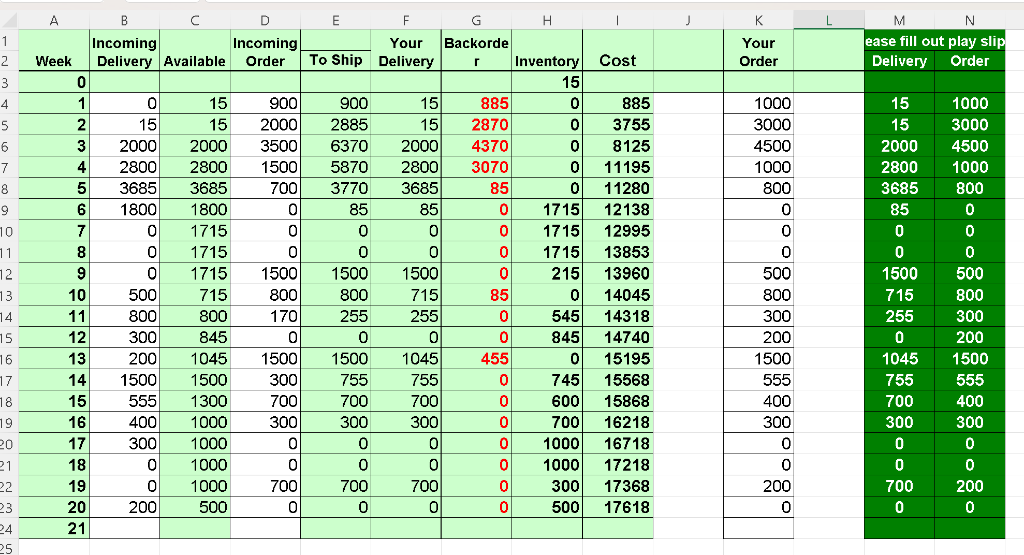
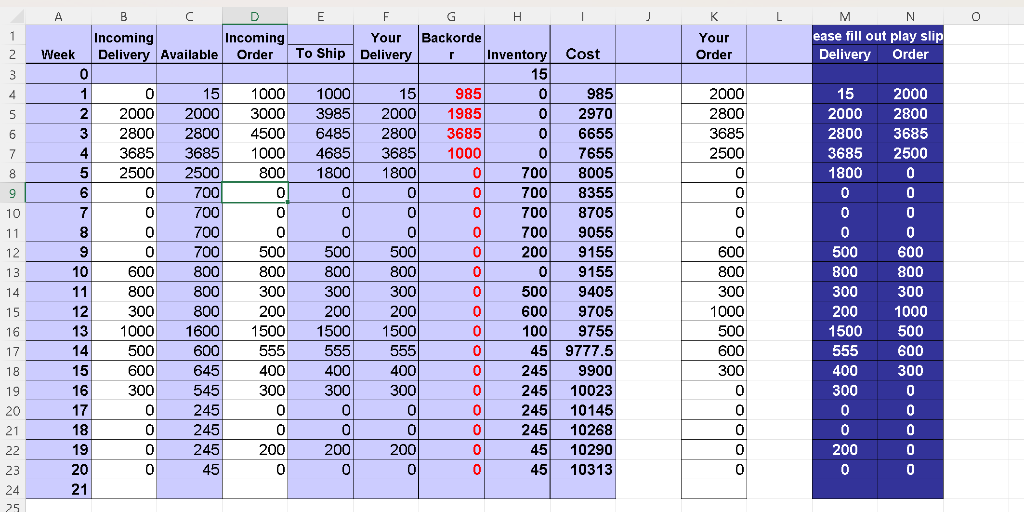
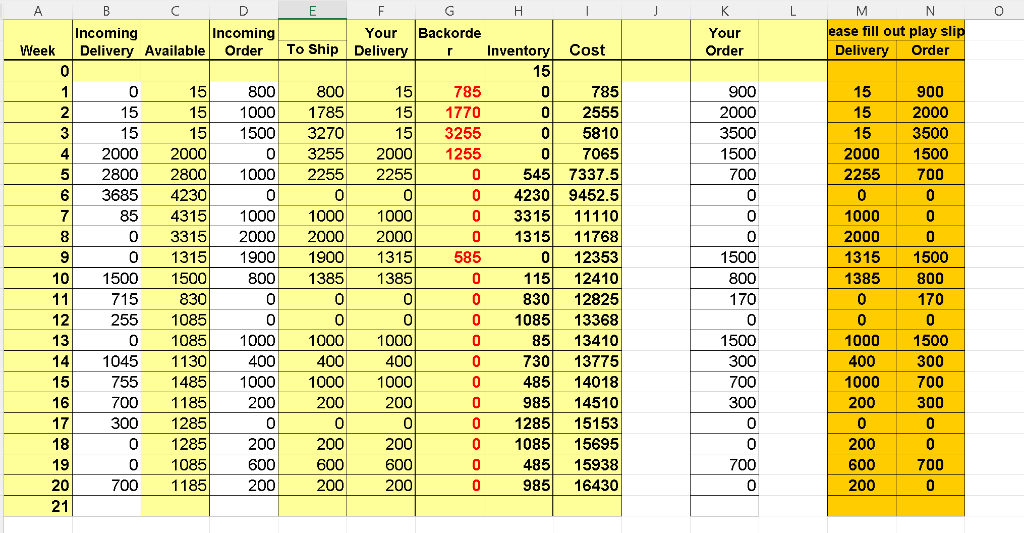
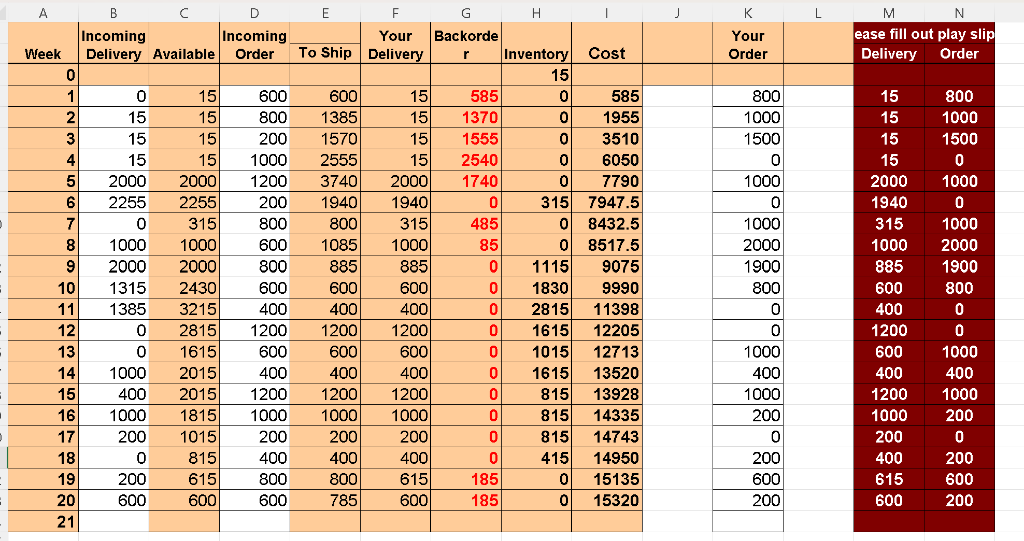
A thorough Analysis of the beer game data Interpretation of the beer game (See Data in Excel File) Analyse the provided beer game data using Excel. In doing so, you might follow these steps: a. Plot the orders for every supply chain role in one graph (x-axis: weeks, y-axis: orders, all four roles in one graph). b. Plot the inventory (backorder is negative inventory - x-axis: weeks, y-axis: inventory/backorder, all four roles in one graph) c. Plot the cumulative costs (x-axis: weeks, y-axis: cost, all four roles in one graph) Discuss the data: 1. Using your analysis, what do you observe about the degree of fluctuation in the order quantity (and inventory levels) for each role? Explain the effect you observe (refer to your data plots). 2. What do you think contributes to this effect? 3. What are the implications for the retailer and the factory 5. Reflection on the strategies used in playing the game • Critical analysis of the data • Incorporates relevant supply chain concepts learned from the game.
https://www.dropbox.com/s/hv8b1ipsdk6w3lv/Beer%20Game%20of%2020%20Weeks.xlsx?dl=0
Green is Distributer, Purple is Factory , Yellow is Wholesaler and Orange is Retailer


