Home /
Expert Answers /
Chemistry /
a-the-graph-shows-part-of-a-potential-energy-surface-pes-for-a-molecule-f-pa765
(Solved): (a) The graph shows part of a Potential Energy Surface (PES) for a molecule f ...

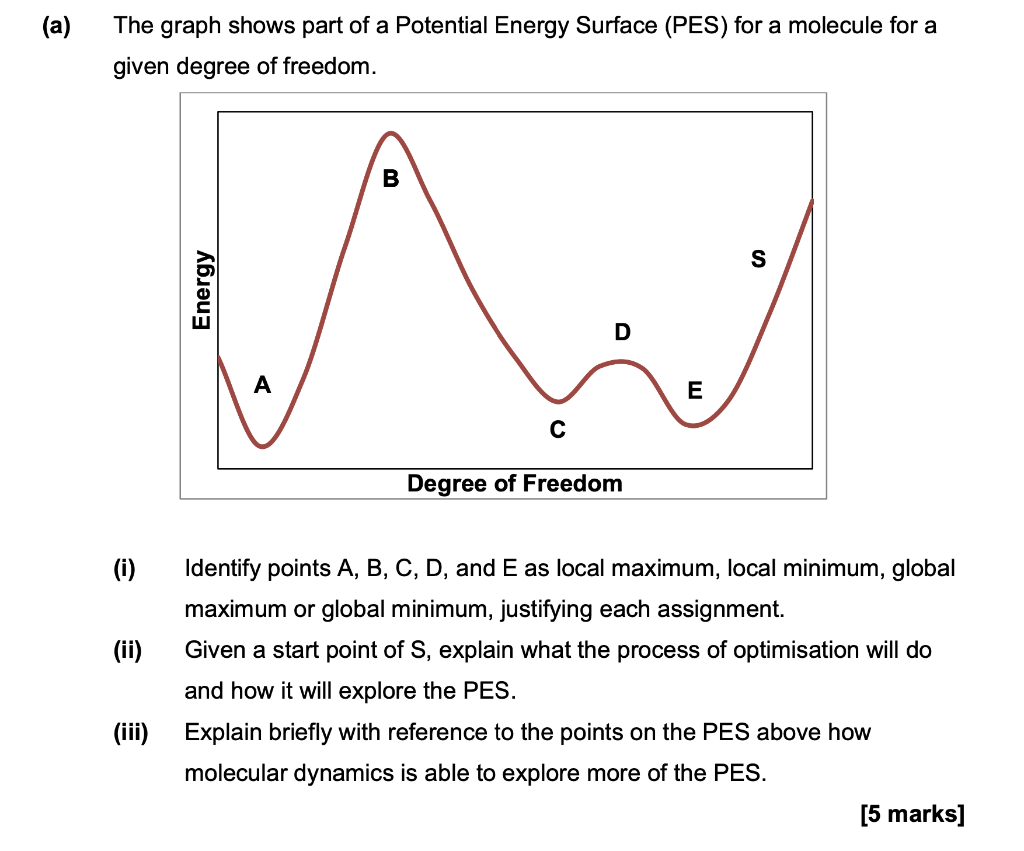
(a) The graph shows part of a Potential Energy Surface (PES) for a molecule for a given degree of freedom. (i) Identify points A, B, C, D, and E as local maximum, local minimum, global maximum or global minimum, justifying each assignment. (ii) Given a start point of \( \mathrm{S} \), explain what the process of optimisation will do and how it will explore the PES. (iii) Explain briefly with reference to the points on the PES above how molecular dynamics is able to explore more of the PES.
Expert Answer
Explanation : i ) C and E are at local minimum because in the neigh