Home /
Expert Answers /
Statistics and Probability /
a-select-a-scatter-diagram-for-these-data-with-the-speed-of-execution-as-the-independent-variabl-pa402
(Solved): a. Select a scatter diagram for these data with the speed of execution as the independent variabl ...
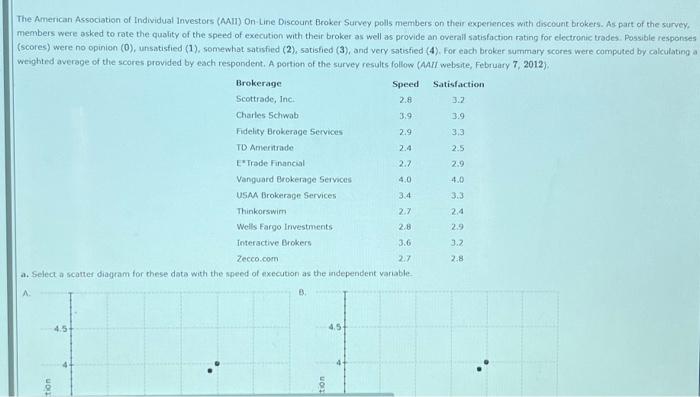
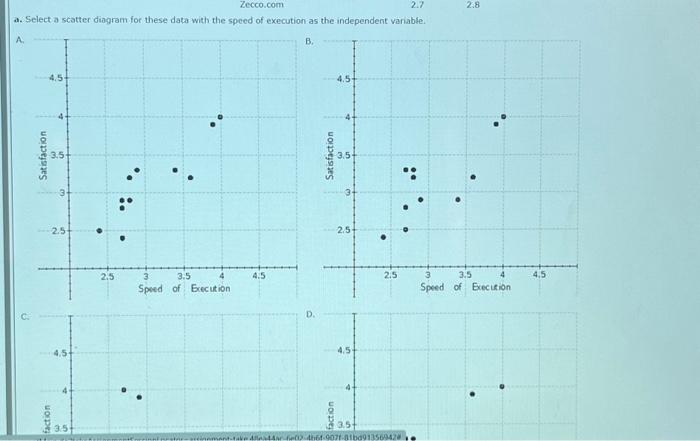
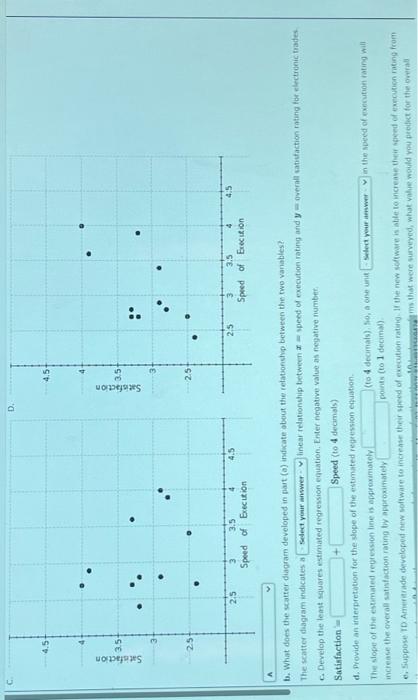
a. Select a scatter diagram for these data with the speed of execution as the independent variable.
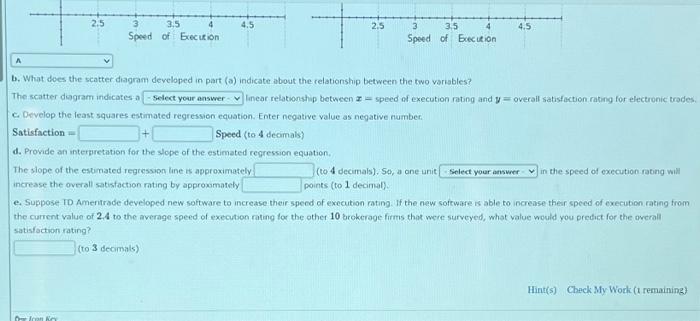
b. What does the scatter diagram developed in part (a) indicate about the relationship between the two variables? The scatter digram indicates a linear relationstip between speed of execution rating and overall satisfaction rating for electronic trodes. c. Develop the least squares estimated regression equation. Enter negative value as negative number. Satisfaction Speed (to 4 decimals) d. Pronde an interpretation for the slope of the estimated regression equation. The slope of the estumated regression line is approximately (to 4 decimals). 50 , a one unit in the speed of exccution rating will increase the overall satisfoction rating by approxumately points (to 1 decirnal). e. Suppose TD Amentrade developed new software to increase their specd of execution rating. If the new software is able to increase their speed of execubion rating trom the current value of 2,4 to the average speed of execution rating for the other 10 brokerage firms that were surveyed, what value would you predict for the overall satisfoction rating? (to 3 decimals)
The American Association of Individual Investors (AAII) On-Line Discount Broker Survey polls members on their experiences with discount brokers. As part of the survey, members were asked to rate the quality of the speed of execution with their broker as well as provide an overall satisfaction rating for electronic trades. Possible responses (scores) were no opinion ( 0 ), unsatisfied (1), somewhat satusfied (2), satisfied (3), and very satisfied (4), for each braker summary scores were computed by calculating weighted average of the scores provided by each respondent. A portion of the survev results follow (AAII website, February 7,2012 ).
b. What does the scatter diagram developed in part (o) indicate obout the relationship between the two vanables? The inenter dasgram indicates a c. Develop the least squares estimated regression equation. Enter negative value as negative number: Satisfaction Speed (to 4 decamals) d. Provide an interpretation for the slope of the estimated repression equation- The slopet of the estumated reuression line is epproximotely. (to 4 decimals), so, a orse und In the soecd of exicution rating will increase the overali sutisfaction rating by approximatedr points (to 1 decimal)