Home /
Expert Answers /
Statistics and Probability /
a-sample-of-human-brain-volumes-cm3-is-given-below-use-the-given-data-values-to-identify-the-cor-pa997
(Solved): A sample of human brain volumes (cm3) is given below. Use the given data values to identify the cor ...
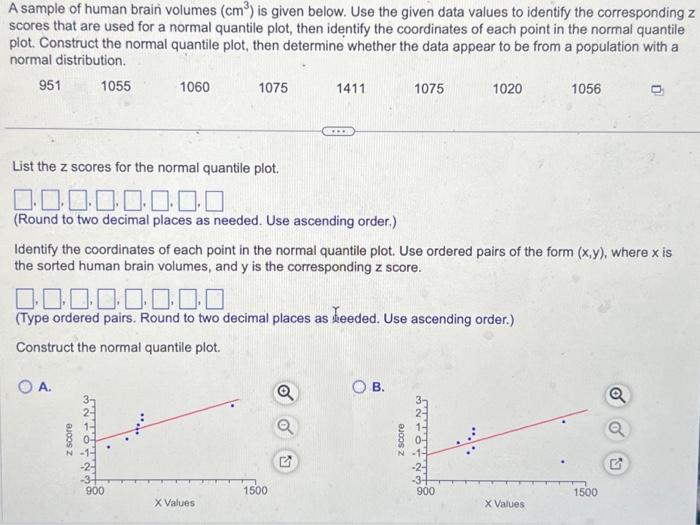
A sample of human brain volumes is given below. Use the given data values to identify the corresponding scores that are used for a normal quantile plot, then identify the coordinates of each point in the normal quantile plot. Construct the normal quantile plot, then determine whether the data appear to be from a population with a normal distribution. List the z scores for the normal quantile plot. (Round to two decimal places as needed. Use ascending order.) Identify the coordinates of each point in the normal quantile plot. Use ordered pairs of the form , where is the sorted human brain volumes, and is the corresponding score. (Type ordered pairs. Round to two decimal places as teeded. Use ascending order.) Construct the normal quantile plot. A. B.
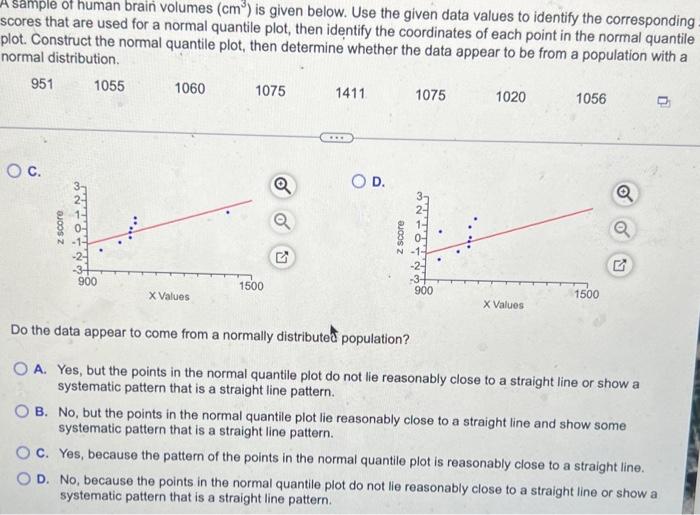
A sample of human brain volumes is given below. Use the given data values to identify the corresponding scores that are used for a normal quantile plot, then identify the coordinates of each point in the normal quantile plot. Construct the normal quantile plot, then determine whether the data appear to be from a population with a normal distribution. 951 1055 1060 1075 1411 1075 1020 1056 c. D. Do the data appear to come from a normally distributed population? A. Yes, but the points in the normal quantile plot do not lie reasonably close to a straight line or show a systematic pattern that is a straight line pattern. B. No, but the points in the normal quantile plot lie reasonably close to a straight line and show some systematic pattern that is a straight line pattern. C. Yes, because the pattern of the points in the normal quantile plot is reasonably close to a straight line. D. No, because the points in the normal quantile plot do not lie reasonably close to a straight line or show a systematic pattern that is a straight line pattern.