Home /
Expert Answers /
Statistics and Probability /
a-sample-of-20-emergency-response-times-measured-in-minutes-is-shown-in-the-graph-using-five-cla-pa747
(Solved): A sample of 20 emergency response times, measured in minutes, is shown in the graph using five cla ...
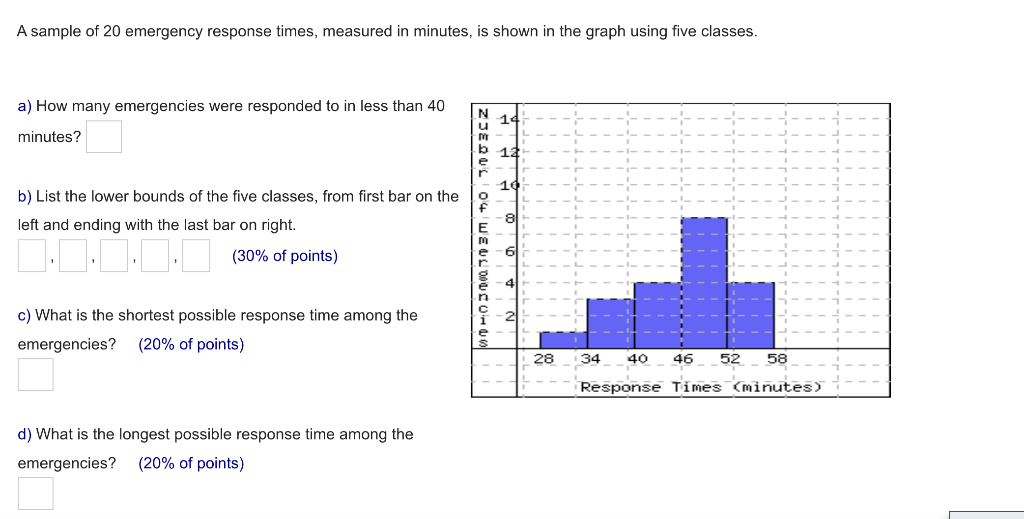
A sample of 20 emergency response times, measured in minutes, is shown in the graph using five classes. a) How many emergencies were responded to in less than 40 minutes? b) List the lower bounds of the five classes, from first bar on the left and ending with the last bar on right. ( of points) c) What is the shortest possible response time among the emergencies? ( of points) d) What is the longest possible response time among the emergencies? ( of points)