Home /
Expert Answers /
Statistics and Probability /
a-sample-containing-years-to-maturity-and-percent-yield-for-40-corporate-bonds-is-contained-in-t-pa682
(Solved): A sample containing years to maturity and (percent) yield for 40 corporate bonds is contained in t ...
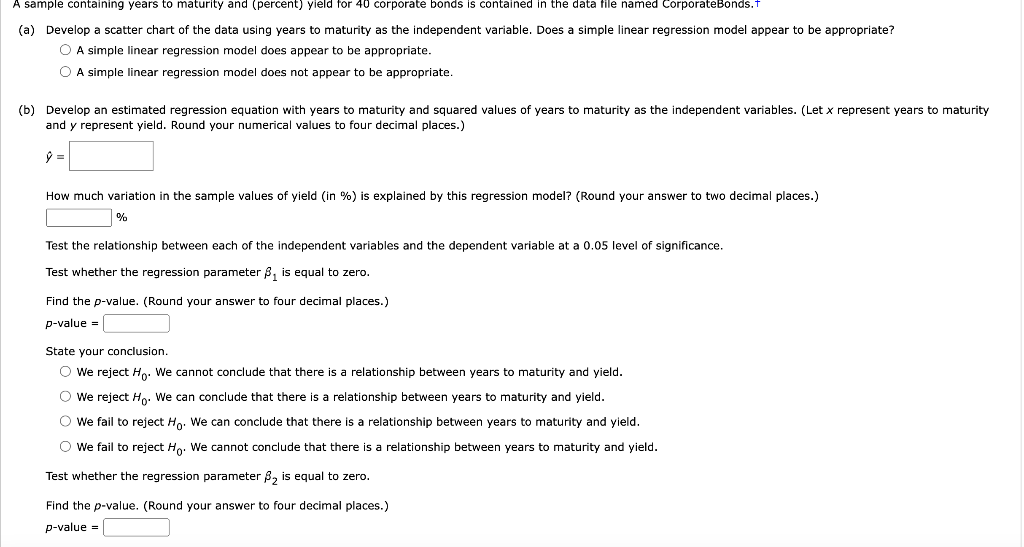
A sample containing years to maturity and (percent) yield for 40 corporate bonds is contained in the data file named corporateBonds. (a) Develop a scatter chart of the data using years to maturity as the independent variable. Does a simple linear regression model appear to be appropriate? A simple linear regression model does appear to be appropriate. A simple linear regression model does not appear to be appropriate. (b) Develop an estimated regression equation with years to maturity and squared values of years to maturity as the independent variables. (Let represent years to maturity and represent yield. Round your numerical values to four decimal places.) How much variation in the sample values of yield (in \%) is explained by this regression model? (Round your answer to two decimal places.) Test the relationship between each of the independent variables and the dependent variable at a 0.05 level of significance. Test whether the regression parameter is equal to zero. Find the -value. (Round your answer to four decimal places.) -value State your conclusion. We reject . We cannot conclude that there is a relationship between years to maturity and yield. We reject . We can conclude that there is a relationship between years to maturity and yield. We fail to reject . We can conclude that there is a relationship between years to maturity and yield. We fail to reject . We cannot conclude that there is a relationship between years to maturity and yield. Test whether the regression parameter is equal to zero. Find the -value. (Round your answer to four decimal places.) -value
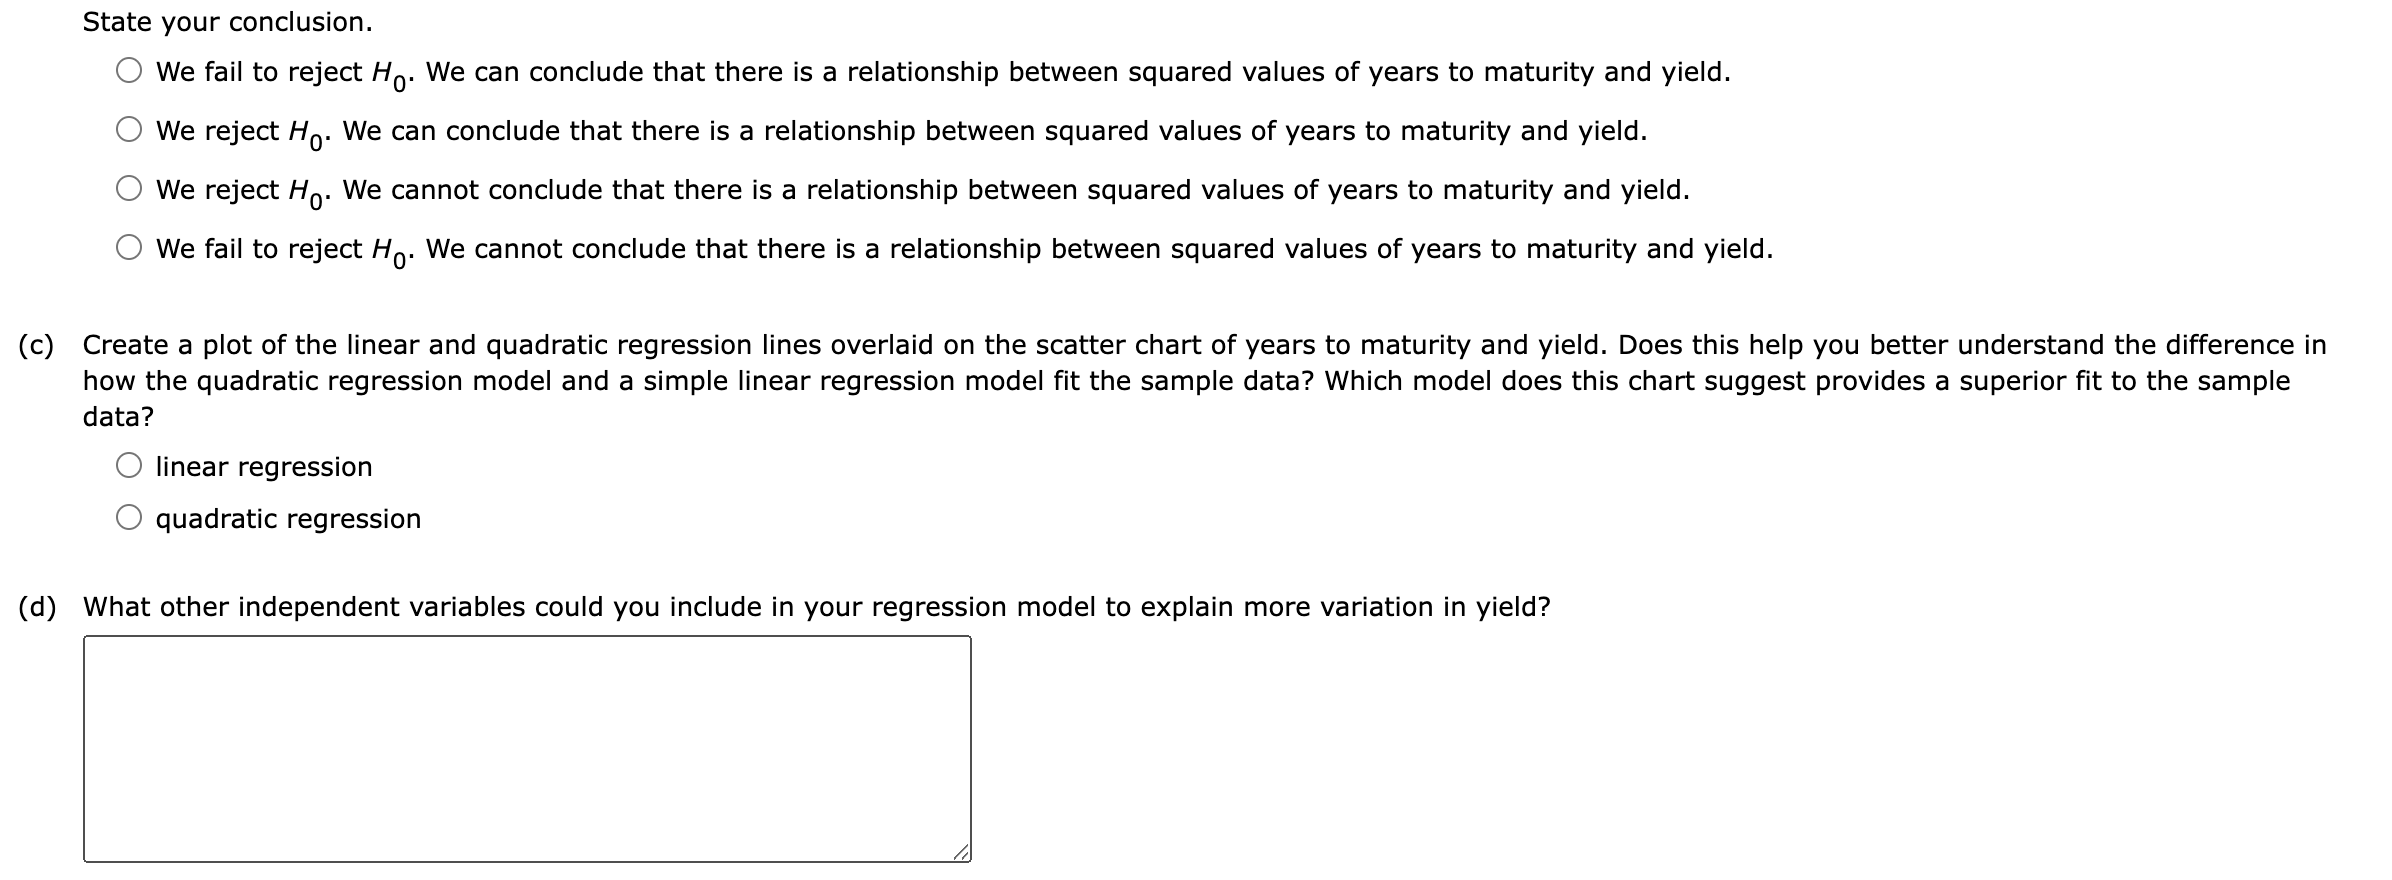
State your conclusion. We fail to reject . We can conclude that there is a relationship between squared values of years to maturity and yield. We reject . We can conclude that there is a relationship between squared values of years to maturity and yield. We reject . We cannot conclude that there is a relationship between squared values of years to maturity and yield. We fail to reject . We cannot conclude that there is a relationship between squared values of years to maturity and yield. c) Create a plot of the linear and quadratic regression lines overlaid on the scatter chart of years to maturity and yield. Does this help you better understand the difference in how the quadratic regression model and a simple linear regression model fit the sample data? Which model does this chart suggest provides a superior fit to the sample data? linear regression quadratic regression d) What other independent variables could you include in your regression model to explain more variation in yield?
Expert Answer
(a) To develop a scatter chart, we need to visualize the data using software such as Excel, R, or Python. Based on the scatter chart, we can determine

