Home /
Expert Answers /
Operations Management /
a-manager-wishes-to-build-a-3-sigma-range-chart-for-a-process-the-sample-size-is-five-the-mean-o-pa217
(Solved): A manager wishes to build a 3-sigma range chart for a process. The sample size is five, the mean o ...
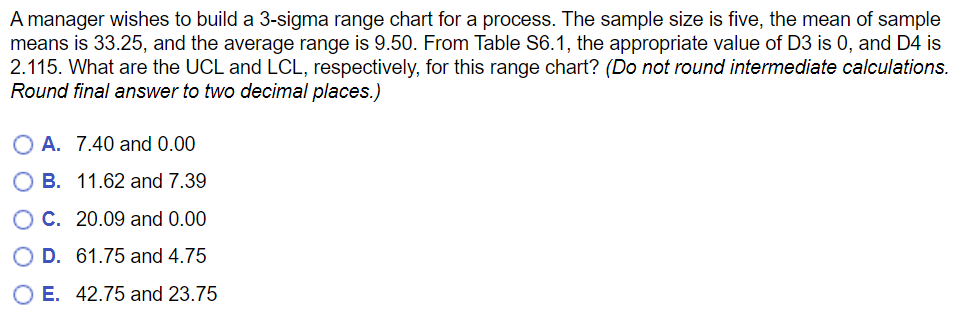
A manager wishes to build a 3-sigma range chart for a process. The sample size is five, the mean of sample means is \( 33.25 \), and the average range is \( 9.50 \). From Table \( S 6.1 \), the appropriate value of \( \mathrm{D} 3 \) is 0 , and \( \mathrm{D} 4 \) is 2.115. What are the UCL and LCL, respectively, for this range chart? (Do not round intermediate calculations. Round final answer to two decimal places.) A. \( 7.40 \) and \( 0.00 \) B. \( 11.62 \) and \( 7.39 \) C. \( 20.09 \) and \( 0.00 \) D. \( 61.75 \) and \( 4.75 \) E. \( 42.75 \) and \( 23.75 \)