Home /
Expert Answers /
Statistics and Probability /
a-let-x-equal-advertising-expenditures-in-thousands-of-doliars-and-y-equal-revenue-pa482
(Solved): (a) Let \( x \) equal advertising expenditures (in thousands of doliars) and \( y \) equal revenue ...
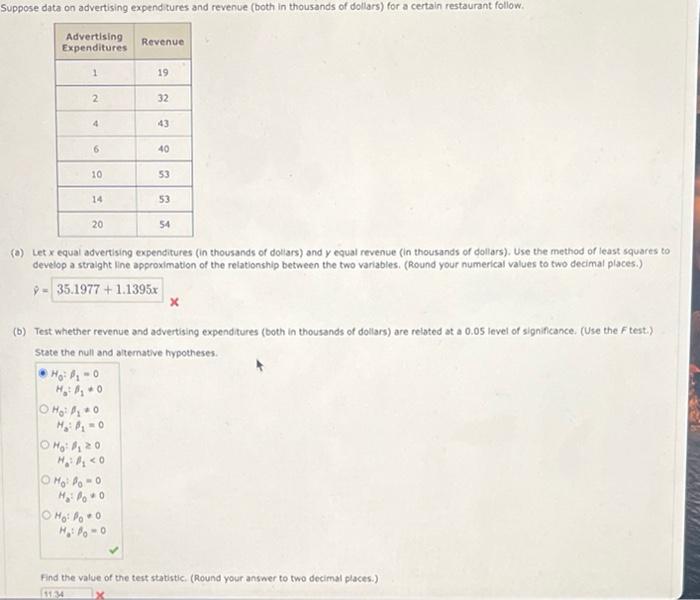
(a) Let \( x \) equal advertising expenditures (in thousands of doliars) and \( y \) equal revenue (in thousands of dollars). Use the method of least squares to develop a straight line approximation of the relationship between the two variables. (Round your numerical values to two decimal places.) \[ \hat{\gamma}= \] (b) Test whether revenue and advertising expenditures (both in thousands of dollars) are related ot a \( 0.05 \) level of significance. (Use the \( F \) test.) State the null and attemative hypotheses. Find the value of the test statistic. (Round your answer to two decimal places.)
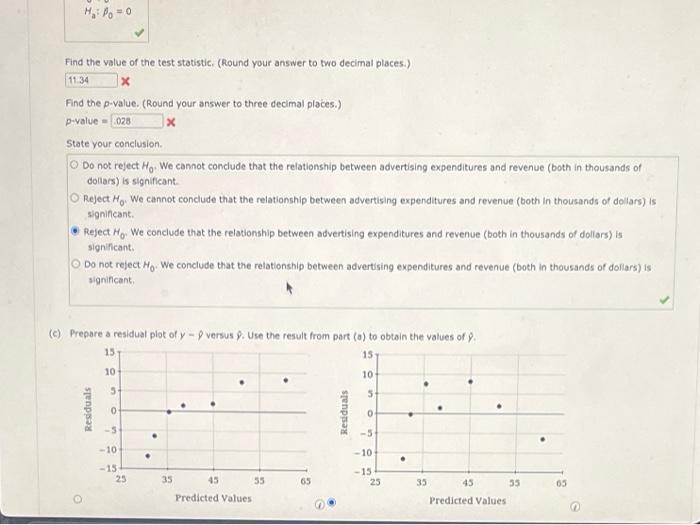
Find the value of the test statistic. (Round your answer to two decimal places.) W Find the p-value. (Round your answer to three decimal places.) \( p \)-value \( = \) State your conclusion. Do not reject \( \mathrm{H}_{0} \). We cannot conclude that the relationship between advertising expenditures and revenue (both in thousands of doliars) is significant. Reject \( \mathrm{H}_{0} \). We cannot conclude that the relationship between advertising expenditures and revenue (both in thousands of dollars) is significant. Reject \( \mathrm{H}_{0} \). We conclude that the relationship between advertising expenditures and revenue (both in thousands of doliars) is significant. Do not reject \( \mathrm{H}_{0} \). We conclude that the relationship between advertising expenditures and revenue (both in thousands of doliars) is significant, (c) Prepare a residual plot of \( y=\phi \) versus \( \phi \). Use the result from part \( (0) \) to obtain the values of \( \phi \).
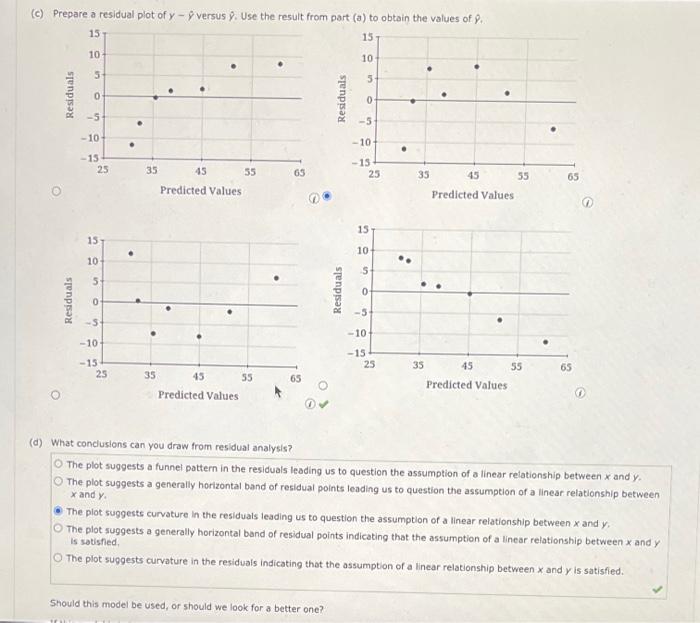
(c) Prepare a residual plot of \( y-\phi \) versus \( \phi \). Use the result from part (a) to obtain the values of \( \phi \). (d) What conduslons can you draw from residual analysis? The plot suggests a funnel pattern in the residuals leading us to question the assumption of a linear relationship between \( x \) and \( y \). The plot suggests a generally horizontal band of residual points leading us to question the assumption of a linear relationship between \( x \) and \( y \). The plot suggests curvature in the residuals leading us to question the assumption of a linear relationship between \( x \) and \( y \). The plot suggests a generally horizontal band of residual points indicating that the assumption of a linear relationship between \( x \) and \( y \) is sotisfied. The plot suggests curvature in the residuals indicating that the assumption of a linear relationship between \( x \) and \( y \) is satisfied. Should this model be used, or should we look for a better one?
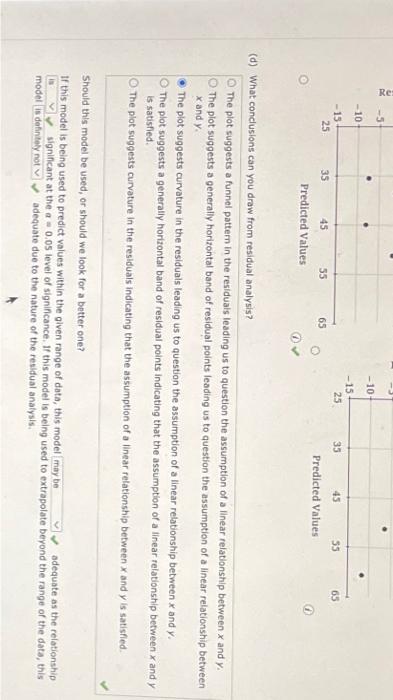
(d) What conclusions can you draw from residual analysis? The plot suggests a funnel pattern in the residuals leading us to question the assumption of a linear relationship between \( x \) and \( y \). The plot suggests a generally horizontal band of residual points leading us to question the assumption of a linear relationship between \( x \) and \( y \). The plot suggests curvature in the residuals leading us to question the assumption of a linear relationship between \( x \) and \( y \). The plot suggests a generally horizontal band of residual points indicating that the assumption of a linear relationship between \( x \) and \( y \) is satisfied. The plot suggests curvature in the residuals indicating that the assumption of a linear relationship between \( x \) and \( y \) is satisfled. Should this model be used, or should we look for a better one? If this model is being used to predict values within the given range of data, this model adequate as the relationship model isigificant at the \( a=0.05 \) level of significance. If this model is being used to extrapolate beyond the range of the data, this adequate due to the nature of the residual analysis.
Expert Answer
we have data on the revenue and advertisement expenditure of certain restaurants. First, find out some of the statistics. Mx= mean of x. My= Mean of y