Home /
Expert Answers /
Mechanical Engineering /
a-fan-diagram-is-shown-in-figure-1-which-transports-40-m3-s-of-a-gas-with-a-density-of-0-975-kg-pa391
(Solved): A fan diagram is shown in figure 1, which transports 40 m3 / s of a gas with a density of 0.975 kg / ...
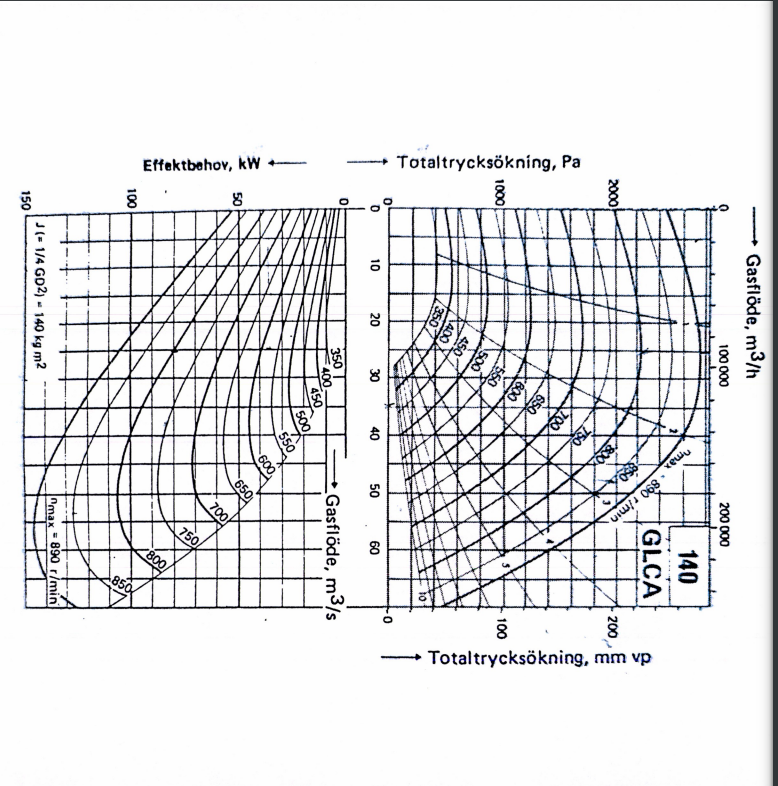
A fan diagram is shown in figure 1, which transports 40
m3 / s of a gas with a density of 0.975 kg /
m3. The total pressure increase is then 1300 Pa.
Calculate the number of revolutions at which the fan is running and
its power consumption.
Totaltrycksökning, Pa Effektbehov, kW - 2000 1000 100 150 Gasflöde, m3/h 100 000 10 400 20 450 500 550 BOO 30 350 400 J(-1/4 GD2) - 140 kg m2 700 650 2 450 40 7500 nmax 2850 550 800x 600 50 200 000 140 GLCA 650 890 r/min. 60 700 Gasflöde, m3/s 750 800 850 200 max 890 r/min 100 -0 Totaltrycksökning, mm vp