Home /
Expert Answers /
Statistics and Probability /
a-develop-a-scatter-diagram-for-these-data-with-age-as-the-independent-variable-b-what-does-t-pa176
(Solved): (a) Develop a scatter diagram for these data with age as the independent variable. (b) What does t ...
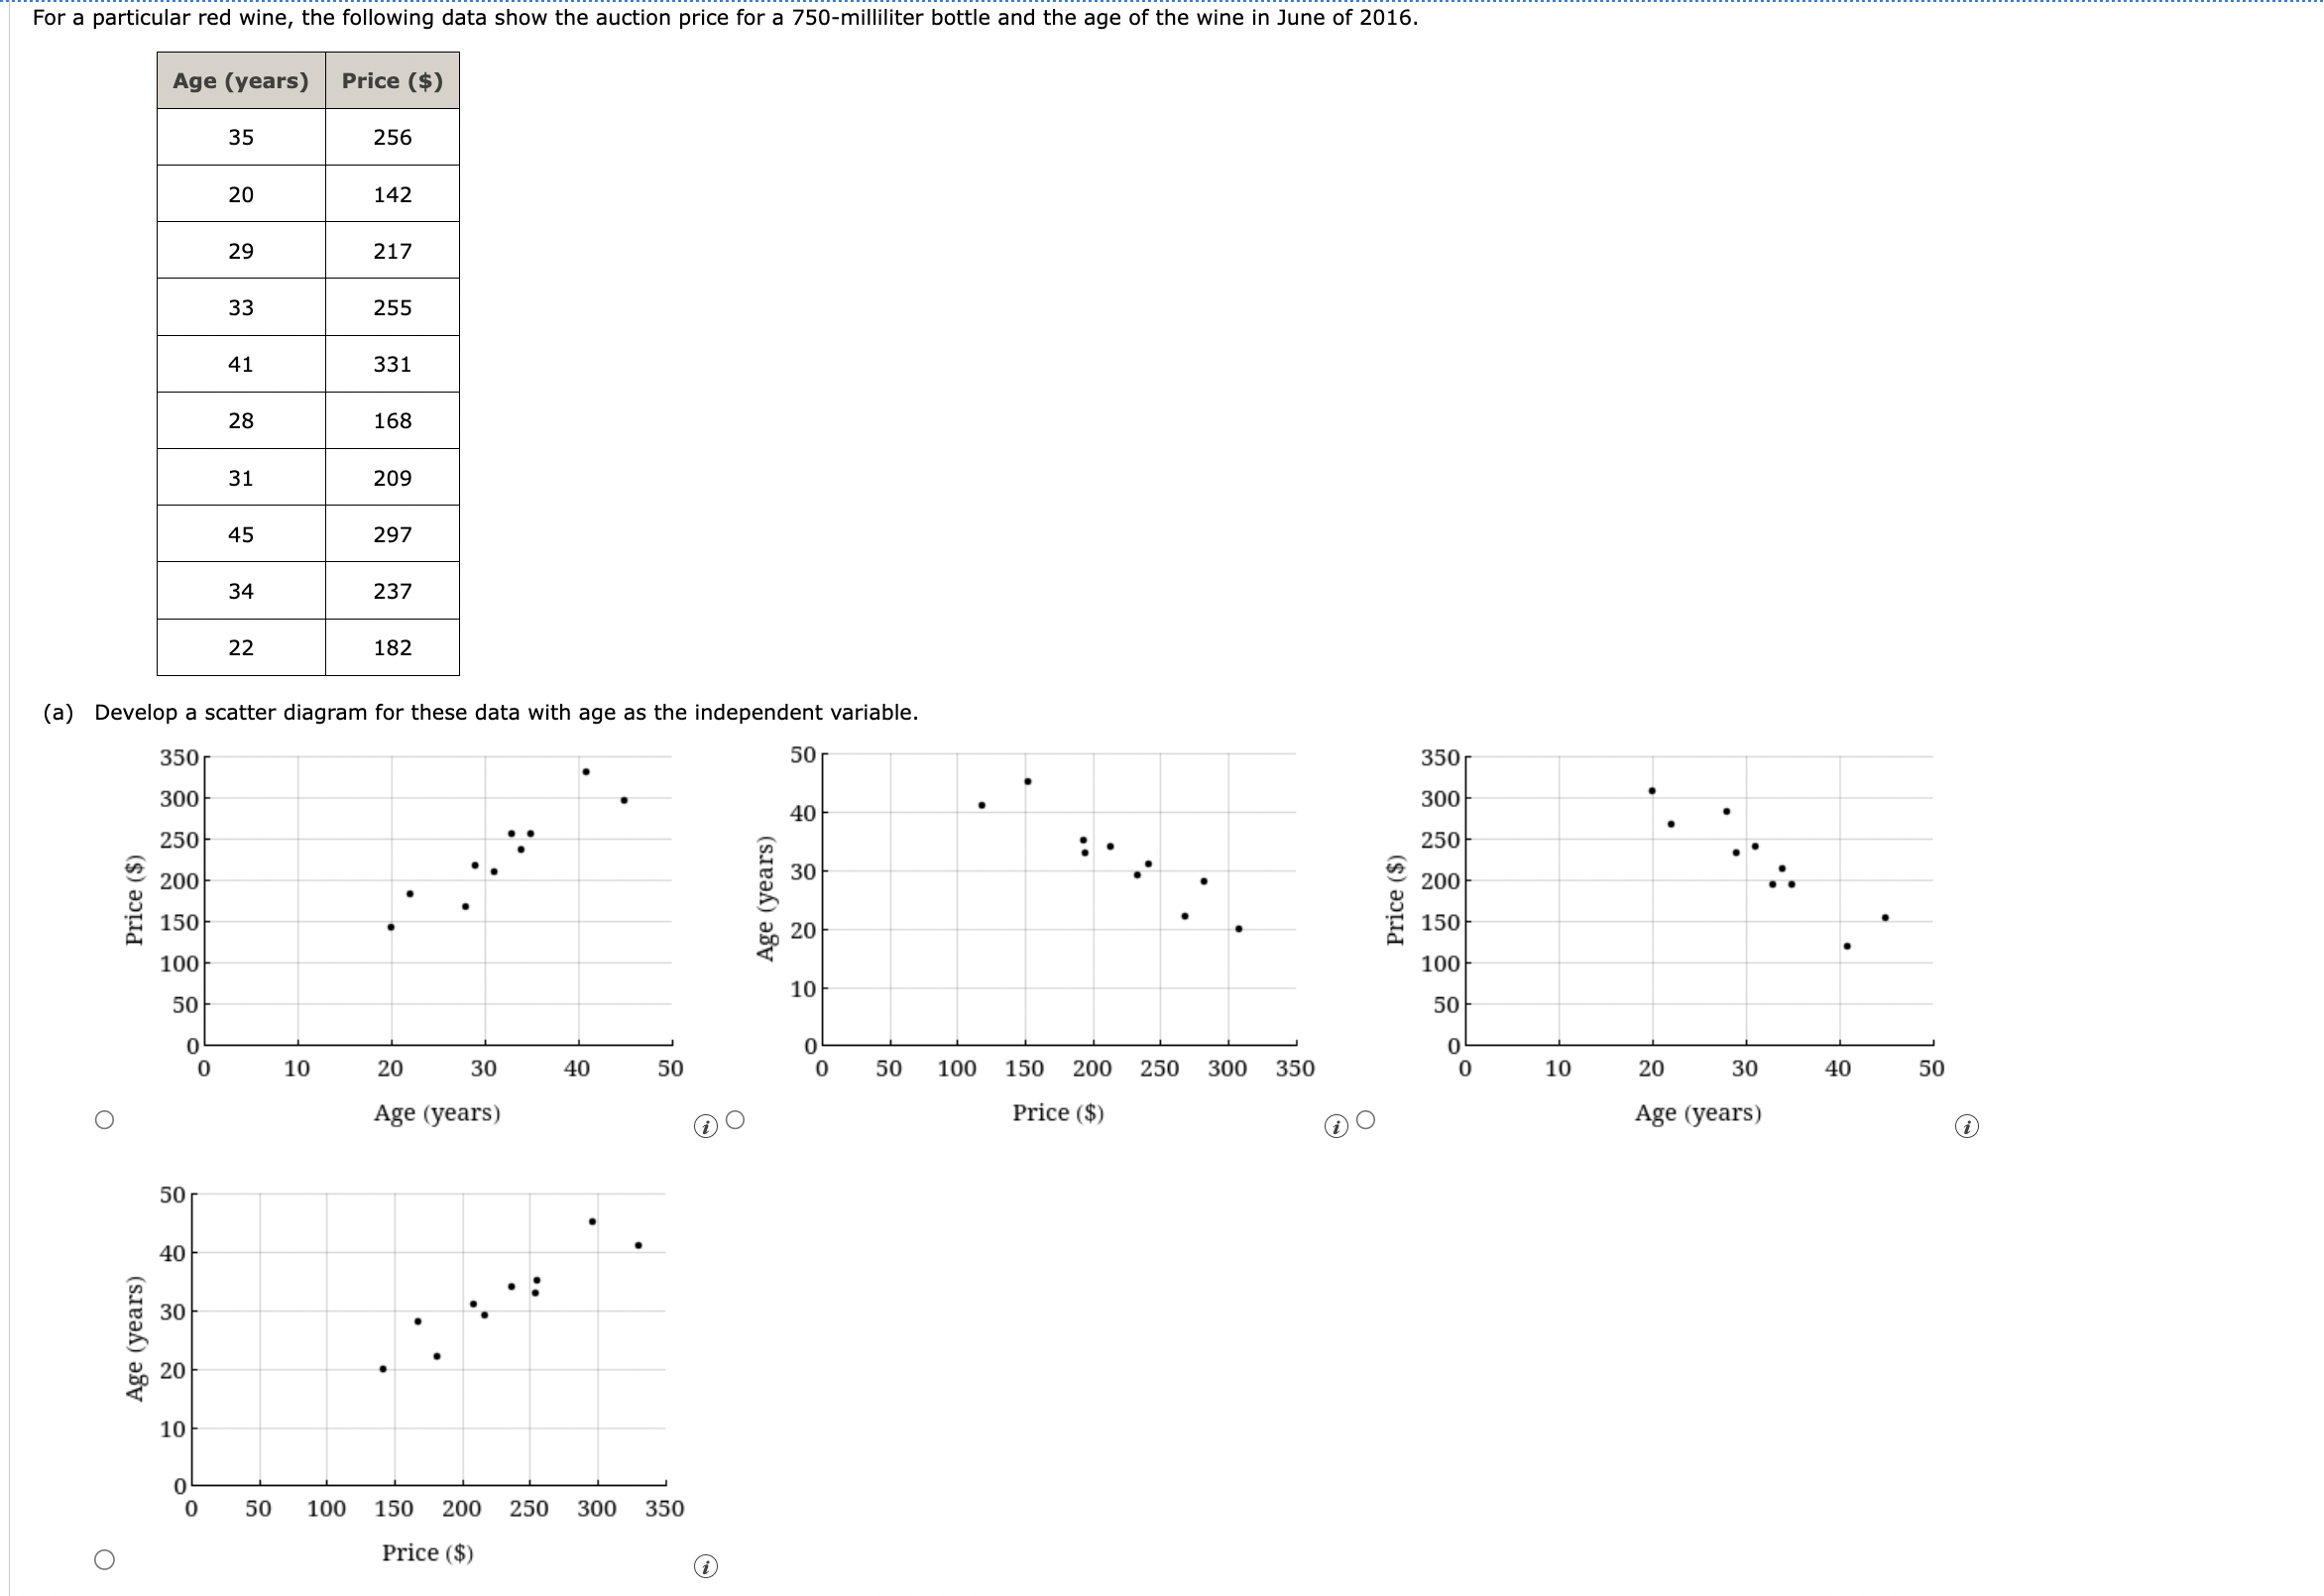
(a) Develop a scatter diagram for these data with age as the independent variable.
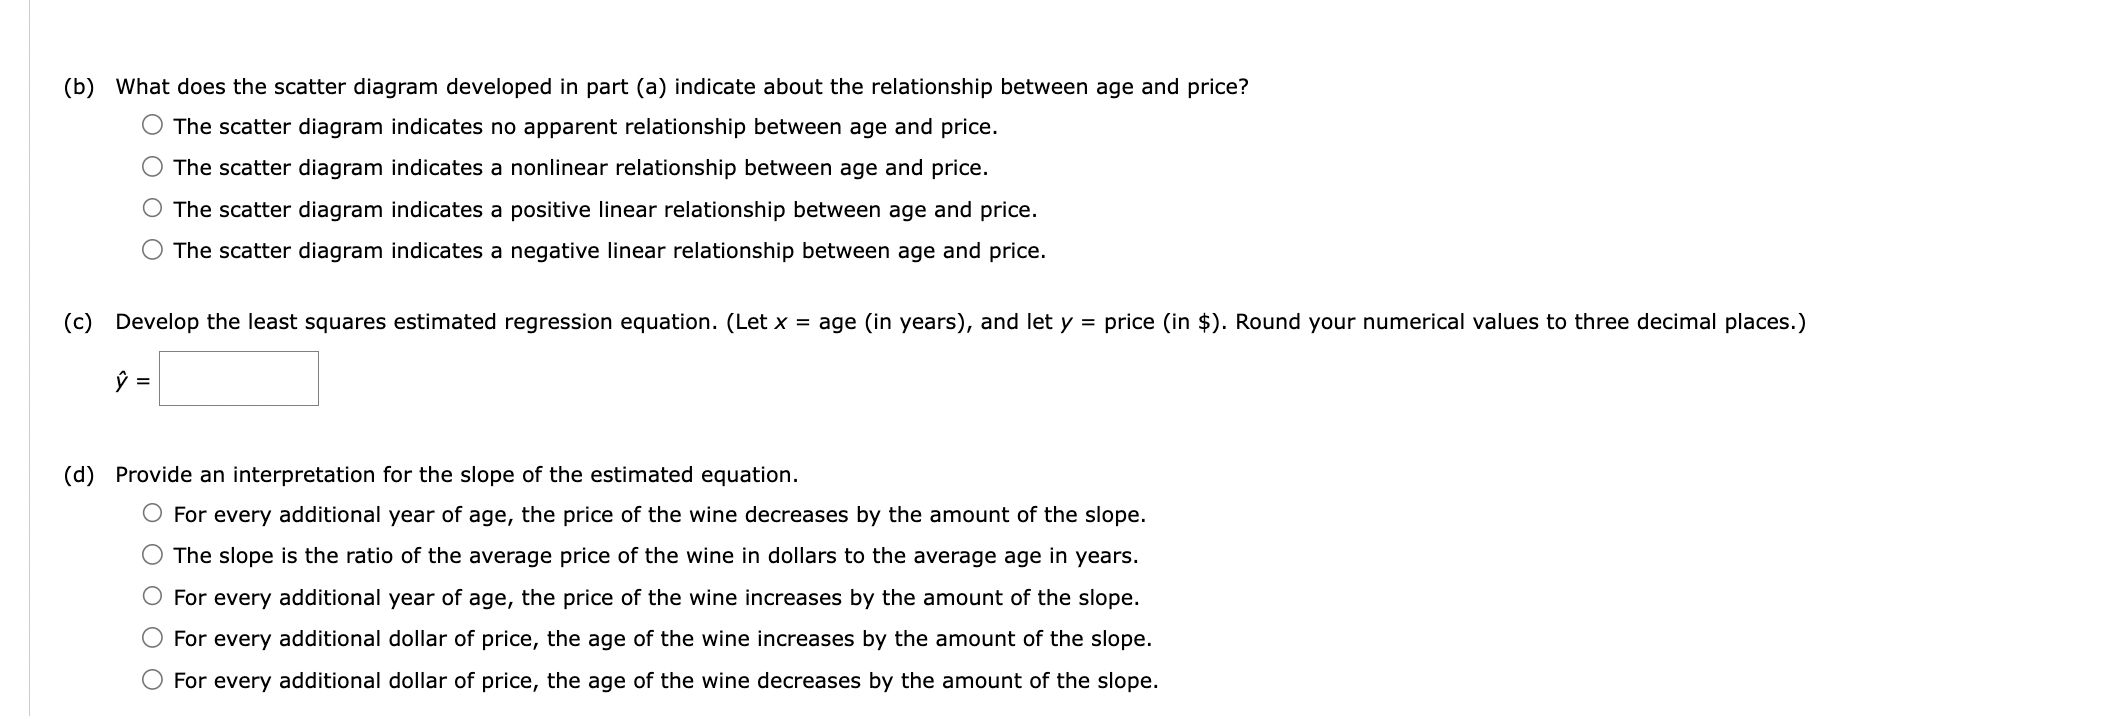
(b) What does the scatter diagram developed in part (a) indicate about the relationship between age and price? The scatter diagram indicates no apparent relationship between age and price. The scatter diagram indicates a nonlinear relationship between age and price. The scatter diagram indicates a positive linear relationship between age and price. The scatter diagram indicates a negative linear relationship between age and price. (c) Develop the least squares estimated regression equation. (Let age (in years), and let price (in ). Round your numerical values to three decimal places.) (d) Provide an interpretation for the slope of the estimated equation. For every additional year of age, the price of the wine decreases by the amount of the slope. The slope is the ratio of the average price of the wine in dollars to the average age in years. For every additional year of age, the price of the wine increases by the amount of the slope. For every additional dollar of price, the age of the wine increases by the amount of the slope. For every additional dollar of price, the age of the wine decreases by the amount of the slope.