(Solved): (a) Develop a scatter dagram for arivel time as the independent variable (b) What does the satter c ...
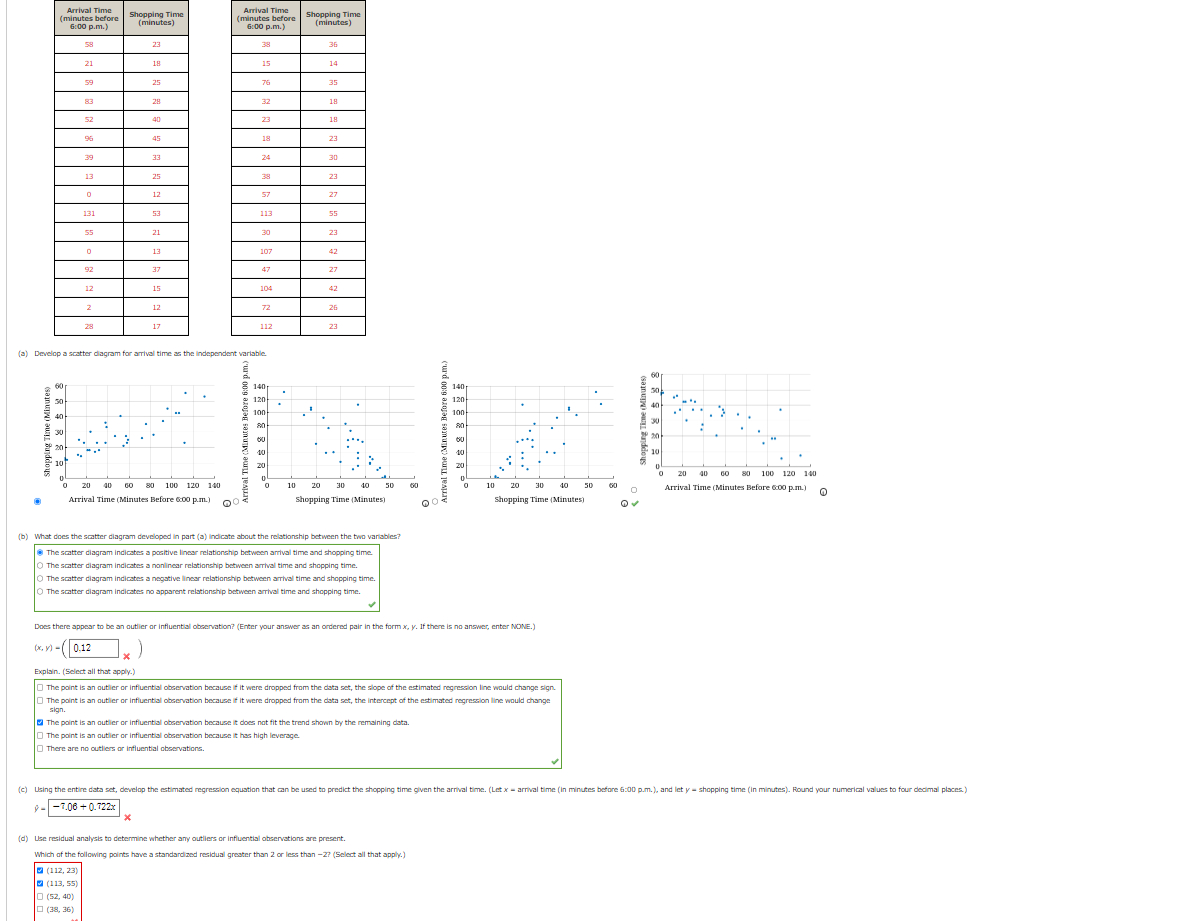
(a) Develop a scatter dagram for arivel time as the independent variable (b) What does the satter clagram developed in part (a) indicate about the relationship between the twa variables? Does there appear to be an autlier or influential oboervation? (Enter your answer as an ordered pair in the form
x,
y. If there is no answer, enter NoNE.)
(x,y)=(,x)Explain. (Select all that apply.)
?The point is an autier or infiuential obGervation because if it were dropped fram the data set, the slope of the ectimated regresalon line wauld change sign.
?The point is an autier or infiuential obaervation because if it were dropped fram the data set, the intercept of the estimated regreraion line wauld change sign. The point is an autier or infiuential obGervation because it does nat fit the trend shown by the remsining data.
?The point is an autier or infiuential obaervation because it has high leverage
?There are no outliers or influential obeervations.
hat(y)=\bar{x} (d) Use residual analysis to determine whether any outliers or infiuential observations are present. Which of the following points have a standardised residual grester than 2 or lese than -2 (Select all that apply.)