Home /
Expert Answers /
Civil Engineering /
a-determine-the-percent-passing-or-finer-than-each-sieve-size-and-summarize-in-table-1-b-plot-pa230
(Solved): a. Determine the percent passing (or finer than) each sieve size and summarize in Table 1. b. Plot ...
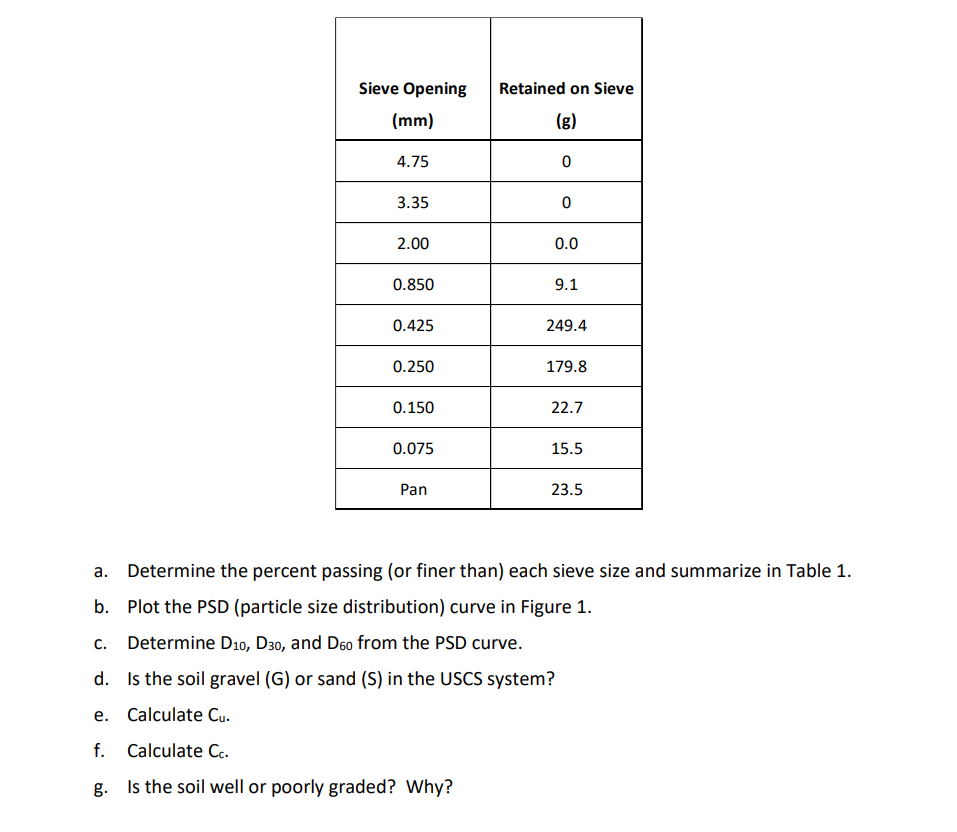
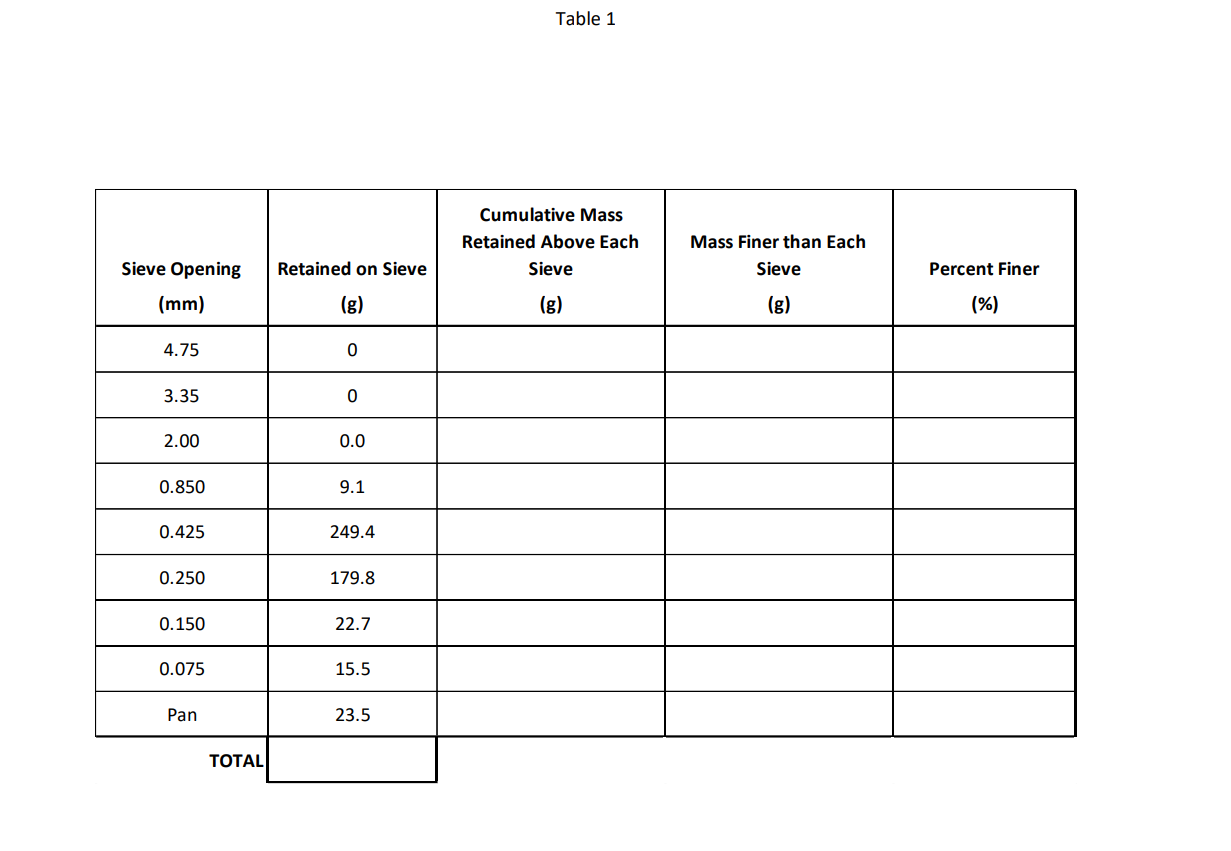
a. Determine the percent passing (or finer than) each sieve size and summarize in Table 1. b. Plot the PSD (particle size distribution) curve in Figure 1. c. Determine \( D_{10}, D_{30} \), and \( D_{60} \) from the PSD curve. d. Is the soil gravel (G) or sand (S) in the USCS system? e. Calculate \( \mathrm{C}_{\mathrm{u}} \). f. Calculate \( \mathrm{C}_{\mathrm{c}} \). g. Is the soil well or poorly graded? Why?
Table 1
Expert Answer
a. sieve size (mm) Mass of soil retained on each sieve (g) cumulative mass retained (A) cumulative percent retained (B) =(A/Total mass) x 100 cumulati

