Home /
Expert Answers /
Precalculus /
a-determine-the-net-change-between-the-indicated-points-on-the-graph-b-determine-the-average-r-pa824
(Solved): (a) Determine the net change between the indicated points on the graph. (b) Determine the average r ...
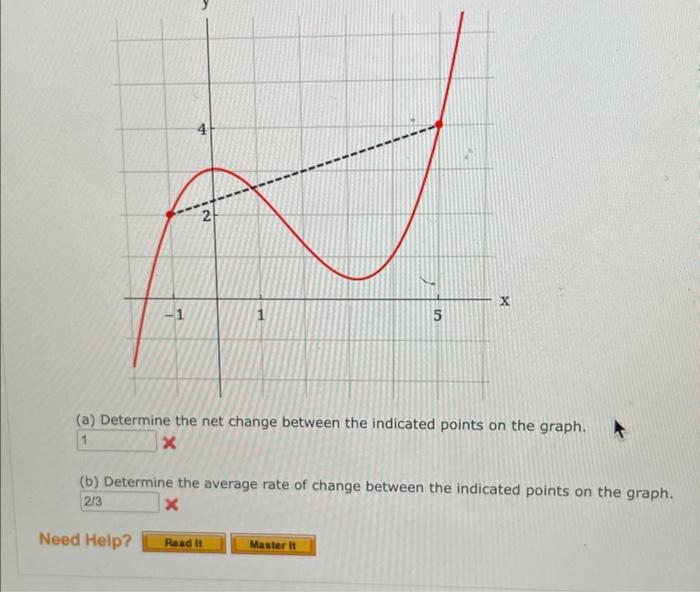
(a) Determine the net change between the indicated points on the graph. (b) Determine the average rate of change between the indicated points on the graph. \( x \)
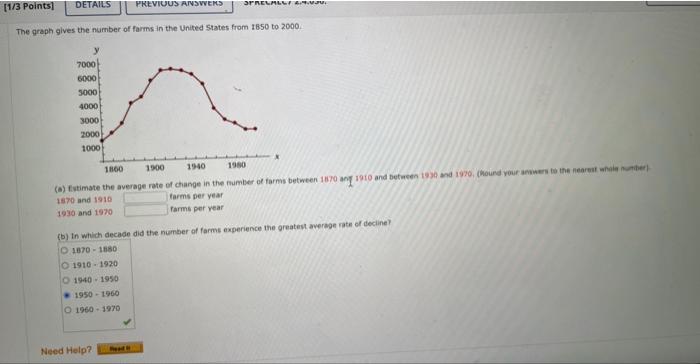
The graph gives the number of farms in the United 5 tates from 1650 to \( 2000 . \) Tarms per year 1870 and 1910 rams per year 1930 and 1970 (b) In which decace did the number of farms experience the areatent average rate of decine? \begin{tabular}{l} \( 1870-1880 \) \\ \( 1910-1920 \) \\ \( 1940+1950 \) \\ \( 1950+1960 \) \\ \( 1960+1970 \) \\ \hline \end{tabular}
Expert Answer
(a) From graph , we find that Coord