Home /
Expert Answers /
Operations Management /
a-design-engineer-wants-to-construct-a-sample-mean-chart-for-controlling-the-service-life-of-one-o-pa200
(Solved): A design engineer wants to construct a sample mean chart for controlling the service life of one o ...
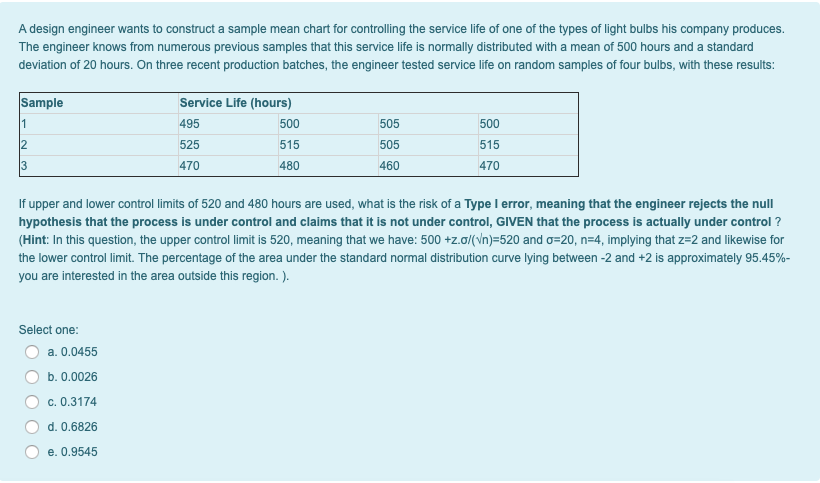
A design engineer wants to construct a sample mean chart for controlling the service life of one of the types of light bulbs his company produces. The engineer knows from numerous previous samples that this service life is normally distributed with a mean of 500 hours and a standard deviation of 20 hours. On three recent production batches, the engineer tested service life on random samples of four bulbs, with these results: If upper and lower control limits of 520 and 480 hours are used, what is the risk of a Type I error, meaning that the engineer rejects the null hypothesis that the process is under control and claims that it is not under control, GIVEN that the process is actually under control ? (Hint: In this question, the upper control limit is 520 , meaning that we have: and , implying that and likewise for the lower control limit. The percentage of the area under the standard normal distribution curve lying between -2 and +2 is approximately you are interested in the area outside this region. ). Select one: a. 0.0455 b. 0.0026 c. 0.3174 d. 0.6826 e. 0.9545