Home /
Expert Answers /
Statistics and Probability /
a-data-set-is-given-below-a-draw-a-scatter-diagram-comment-on-the-type-of-relation-that-appears-pa308
(Solved): A data set is given below. (a) Draw a scatter diagram. Comment on the type of relation that appears ...
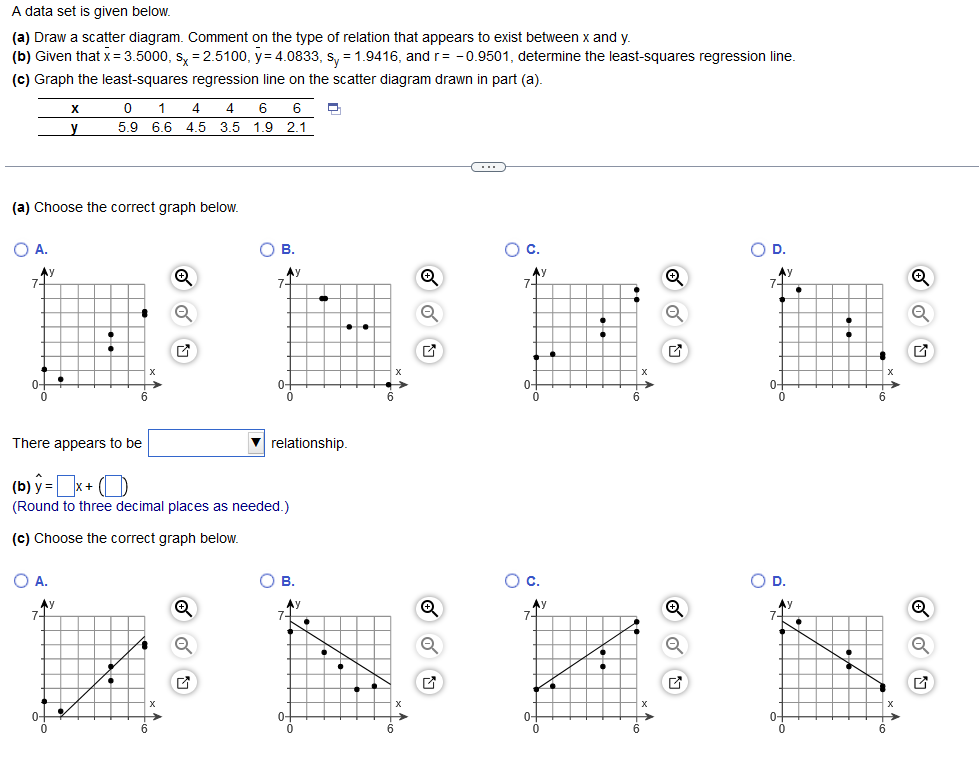
A data set is given below. (a) Draw a scatter diagram. Comment on the type of relation that appears to exist between and . (b) Given that , and , determine the least-squares regression line. (c) Graph the least-squares regression line on the scatter diagram drawn in part (a). (a) Choose the correct graph below. A. B. There appears to be (b) , (Round to three decimal places as needed.) (c) Choose the correct graph below. c. D.