Home /
Expert Answers /
Other Math /
a-construct-a-time-series-plot-of-the-stock-performance-from-the-1900-s-to-the-2000-s-choose-the-pa598
(Solved): a. Construct a time-series plot of the stock performance from the 1900 s to the 2000 s. Choose the ...
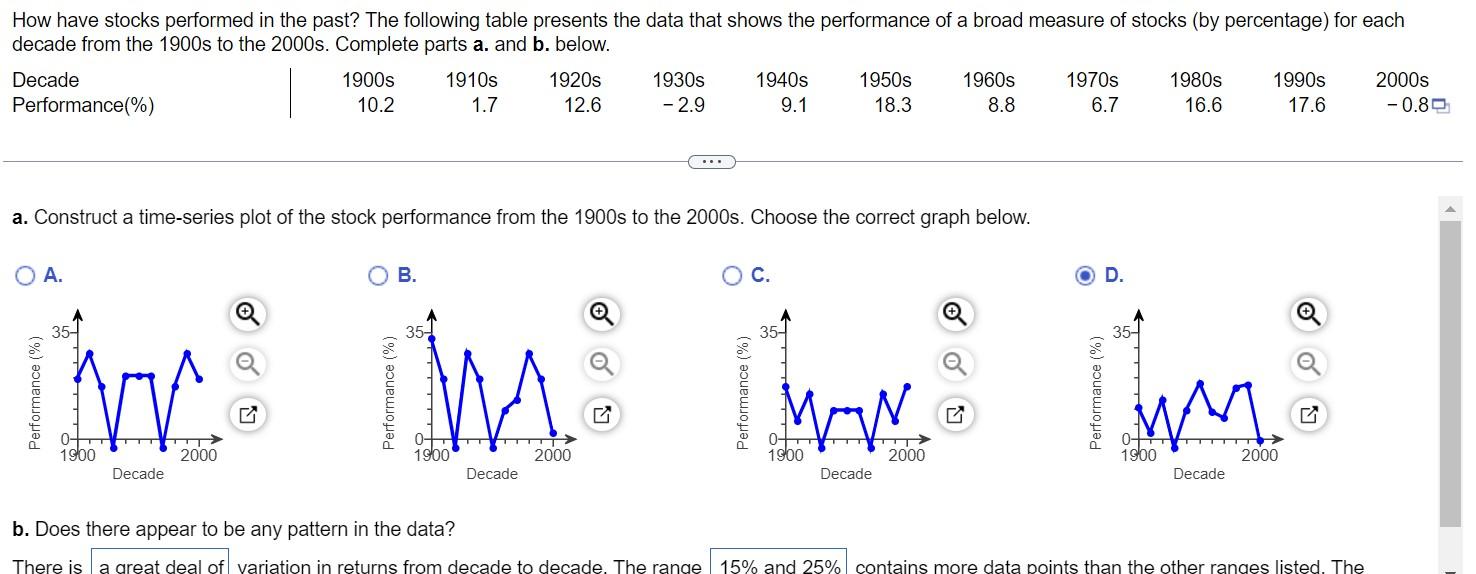
a. Construct a time-series plot of the stock performance from the 1900 s to the 2000 s. Choose the correct graph below. A. B. C. D. b. Does there appear to be any pattern in the data?
b. Does there appear to be any pattern in the data? There is a great deal of variation in returns from decade to decade. The range contains more data points than the other ranges listed. The had exceptionally high returns, and only the had negative returns.
Expert Answer
So, plot (D) is correct. (b) Answer: There is a great deal of

