Home /
Expert Answers /
Chemical Engineering /
a-consider-the-following-diagram-and-the-breakthrough-curve-for-an-adsorption-measurement-in-a-l-pa652
(Solved): (a) Consider the following diagram and the breakthrough curve for an adsorption measurement in a l ...
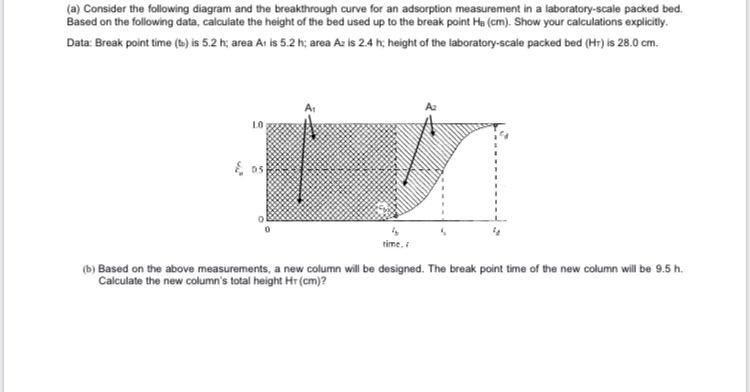
(a) Consider the following diagram and the breakthrough curve for an adsorption measurement in a laboratory-scale packed bed. Based on the following data, calculate the height of the bed used up to the break point \( \mathrm{H}_{\mathrm{a}}(\mathrm{cm} \) ). Show your calculations explicitly. Data: Break point time (b) is \( 5.2 \mathrm{~h} \); area \( \mathrm{A}_{1} \) is \( 5.2 \mathrm{~h} \); area \( \mathrm{A}_{2} \) is \( 2.4 \mathrm{~h} \); height of the laboratory-scale packed bed \( (\mathrm{Hr}) \) is \( 28.0 \mathrm{~cm} \). (b) Based on the above measurements, a new column will be designed. The break point time of the new column will be \( 9.5 \mathrm{~h} \). Calculate the new column's total height \( \mathrm{Hr}(\mathrm{cm}) \) ?