Home /
Expert Answers /
Statistics and Probability /
a-b-find-the-correlation-between-the-two-variables-in-the-scatterplot-what-does-the-size-of-the-co-pa591
(Solved): A.B. Find the correlation between the two variables in the scatterplot. What does the size of the co ...

A.
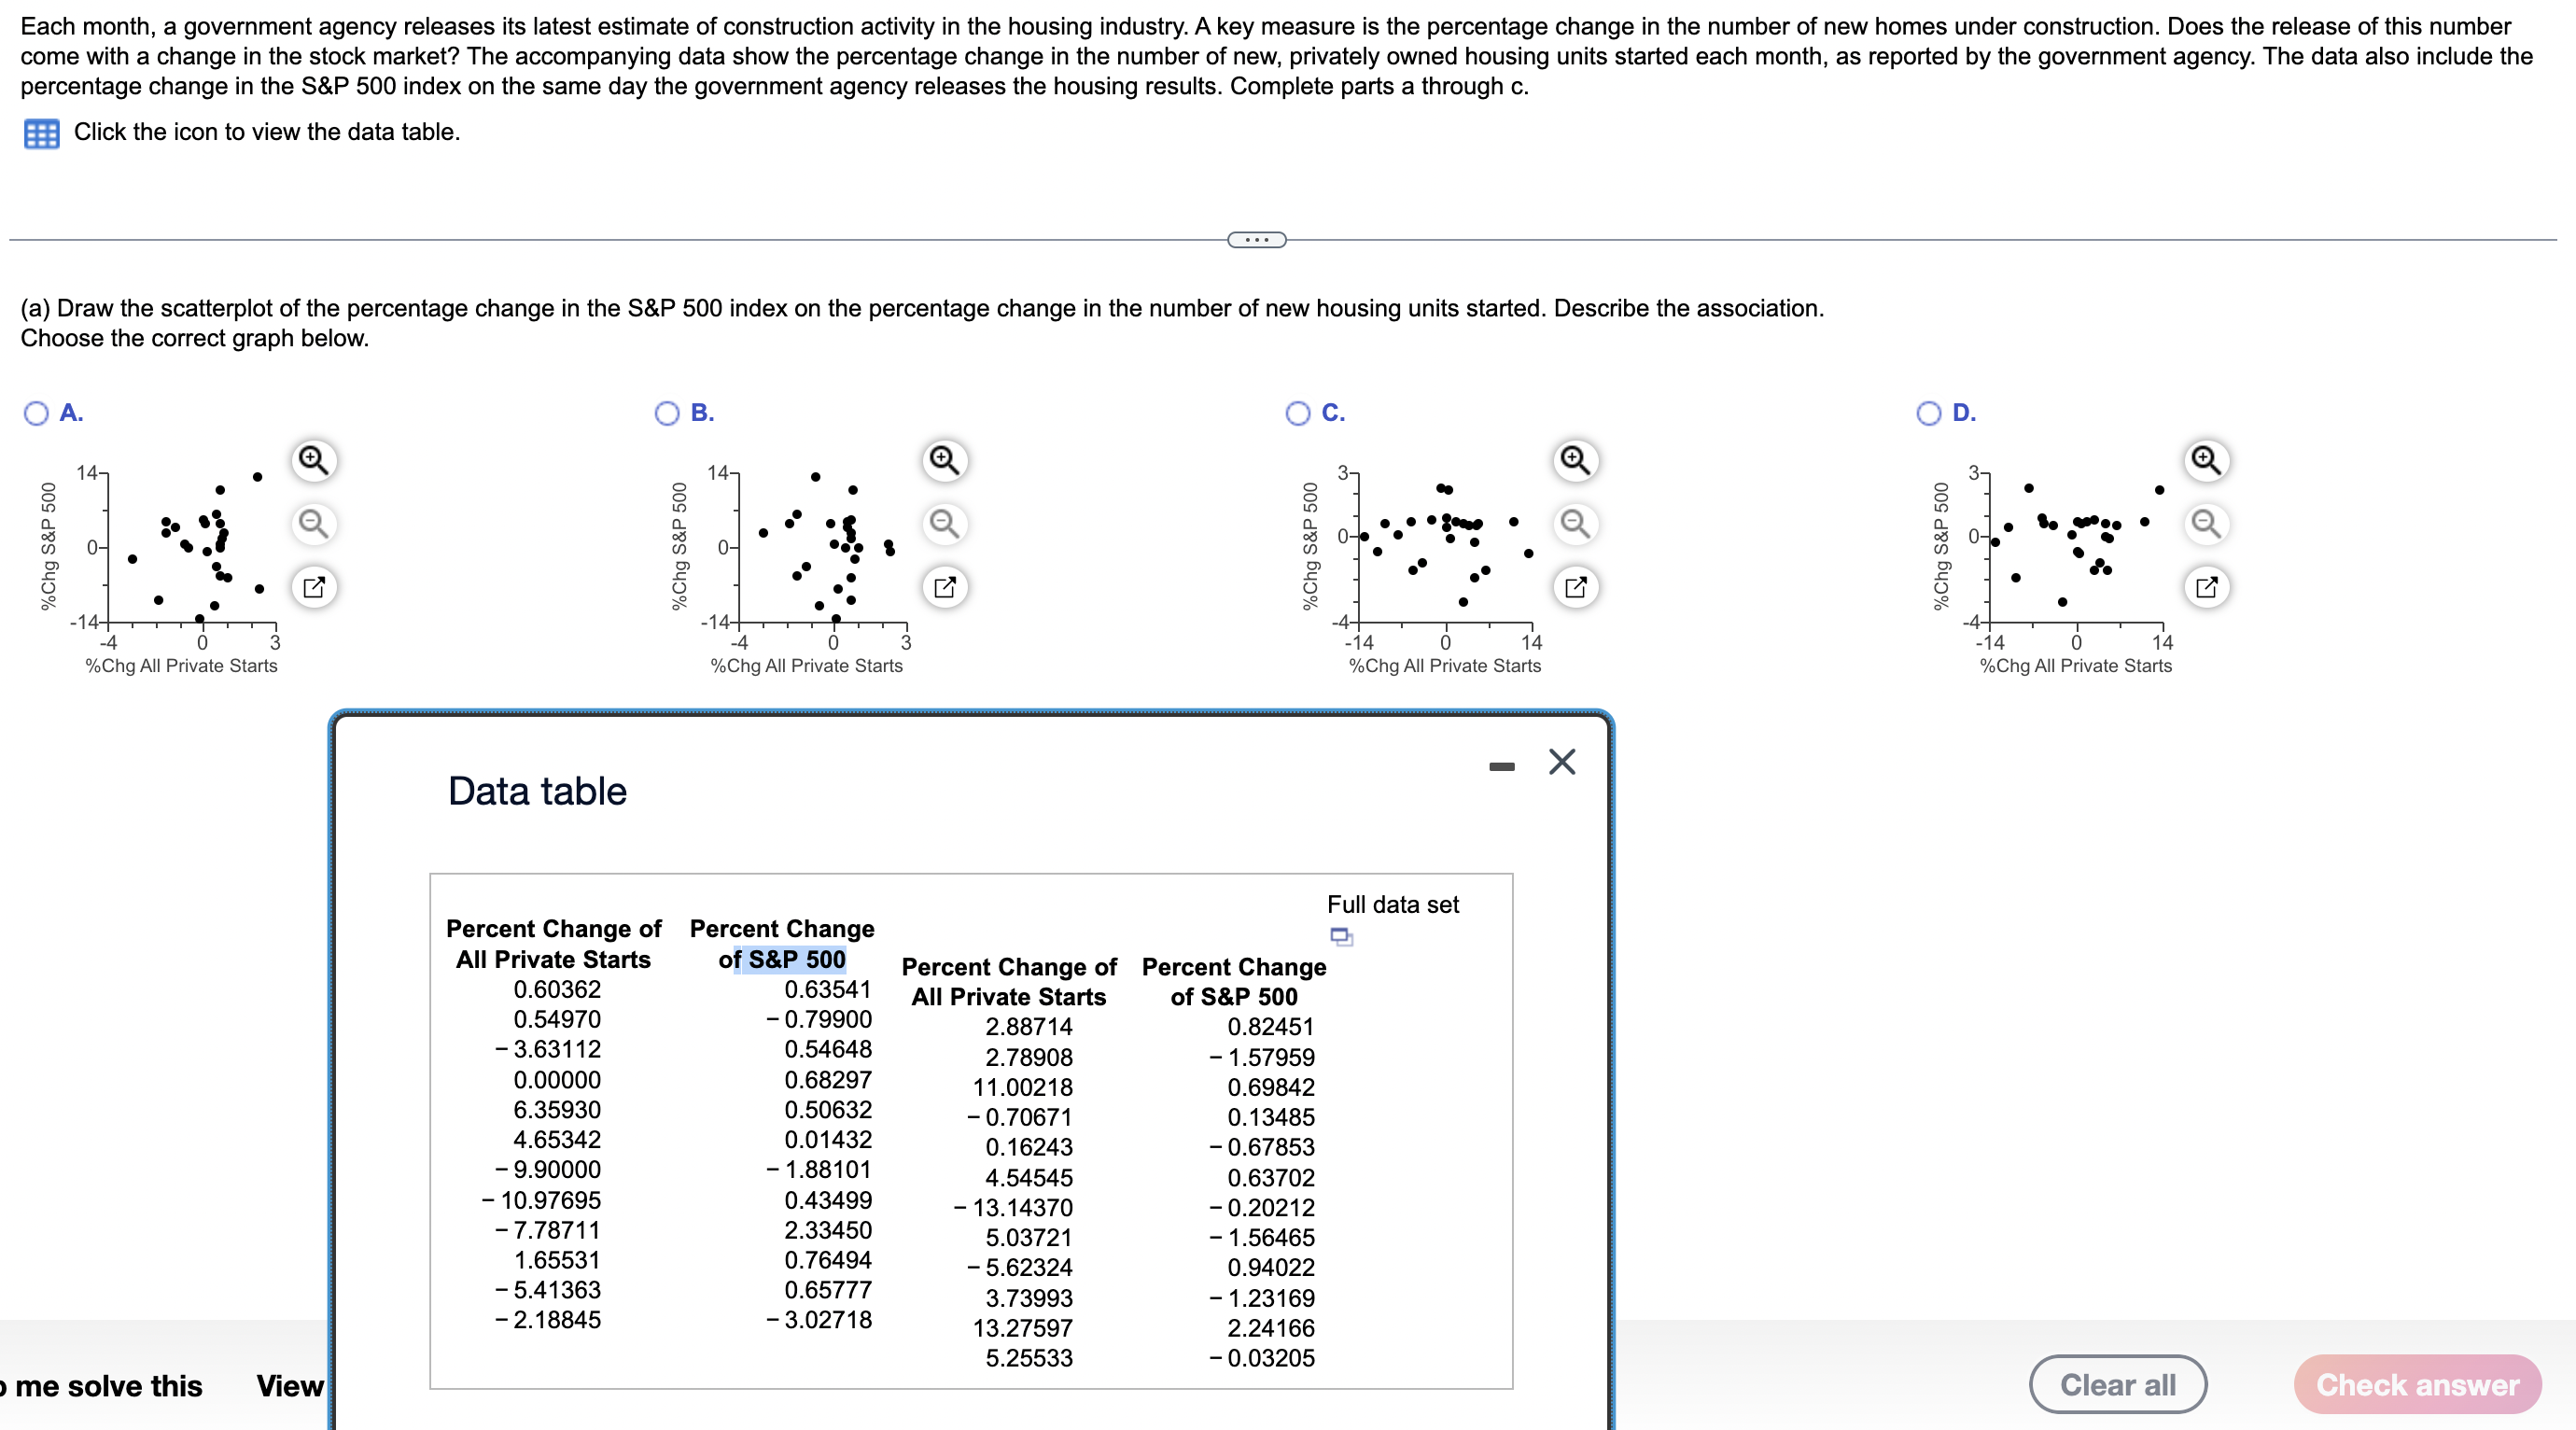
B. Find the correlation between the two variables in the scatterplot. What does the size of the correlation suggest about the strength of the association between these variables?
Describe the correlation below
C. Suppose you know that there was a 5% increase in the number of new homes. From what you've seen, can you anticipate movements in the stock market.
a. no, association too weak
b. yes, strong enough for production
c. no, there is no assocation
percentage change in the S\&P 500 index on the same day the government agency releases the housing results. Complete parts a through . Click the icon to view the data table. (a) Draw the scatterplot of the percentage change in the S\&P 500 index on the percentage change in the number of new housing units started. Describe the association. Choose the correct graph below. A. B. B. c. Data table D. me solve this View