Home /
Expert Answers /
Economics /
8-shifts-in-supply-or-demand-i-the-following-graph-plots-the-market-for-gyros-in-houston-where-th-pa555
(Solved): 8. Shifts in supply or demand I The following graph plots the market for gyros in Houston, where th ...
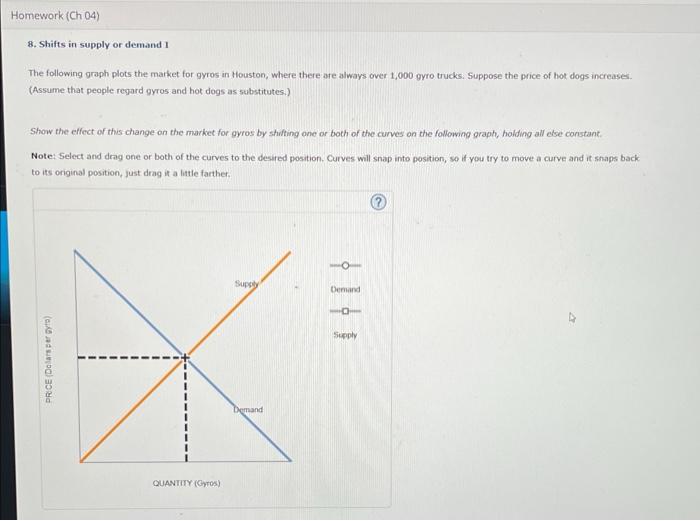
8. Shifts in supply or demand I The following graph plots the market for gyros in Houston, where there are always over 1,000 gyro trucks; 5 uppose the price of hot dogs increases. (Assume that people regard gyros and hot dogs as substitutesi) Show the effect of this change on the market for gyros by shiding one or both of the curves an the following graph, holding all else canstant. Note: Select and drag one or both of the curves to the desired position. Curves will snap into position, so if you try to move a curve and it shaps back to its original position, Just drag it a little farther.
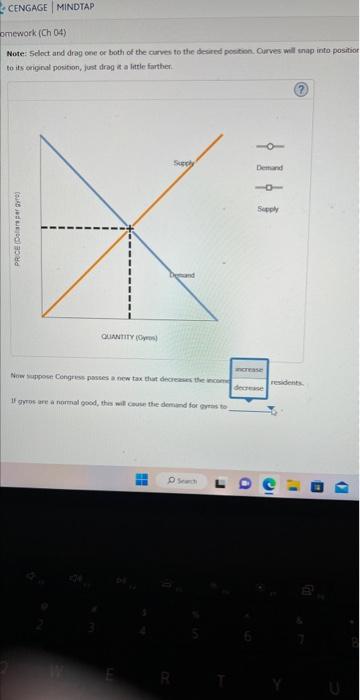
Hote: Scloct and drag one oe both of the carvet to thie desired poestion. Ourves will inap into positio to its eemprall position, just drag is a litle farther. Now tuppoce Congriss pasces a nicw tax thur decteeses the inionin If grops are a niamal geid, this nil cause the deminnd for evtas to
Expert Answer
1) when price of hot dog is increased and gyros and hot dog is substitutes goods