Home /
Expert Answers /
Economics /
8-monetary-policy-and-the-phillips-curve-the-following-graph-plots-the-short-run-phillips-curve-pa694
(Solved): 8. Monetary policy and the Phillips curve The following graph plots the short-run Phillips curve ...
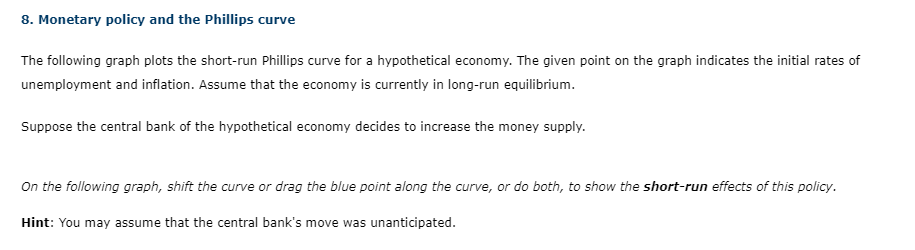
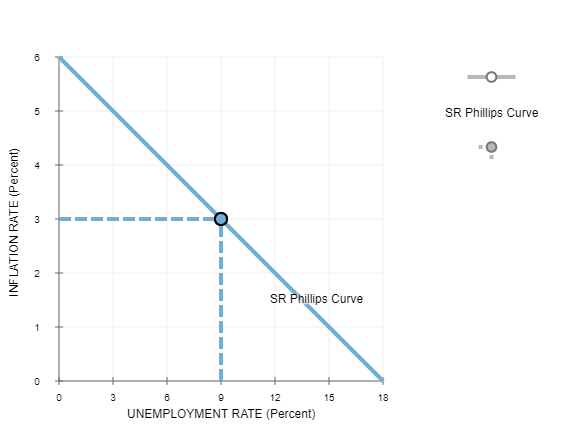
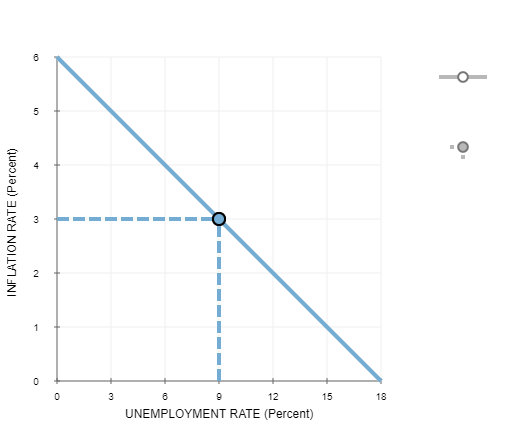

8. Monetary policy and the Phillips curve The following graph plots the short-run Phillips curve for a hypothetical economy. The given point on the graph indicates the initial rates of unemployment and inflation. Assume that the economy is currently in long-run equilibrium. Suppose the central bank of the hypothetical economy decides to increase the money supply. On the following graph, shift the curve or drag the blue point along the curve, or do both, to show the short-run effects of this policy. Hint: You may assume that the central bank's move was unanticipated.\r\n\r\n\r\n\r\n\r\nIn the long run, the increase in the money supply results in (relative to the economy's initial equilibrium). in the inflation rate and in the unemployment rate\r\n\\( \\Delta \\)\r\nIn the short run, an unexpected increase in the money supply results in in the inflation rate and in the unemployment rate. On the following graph, shift the curve or drag the blue point along the curve, or do both, to show the long-run effects of the increase in the money supply.
Expert Answer
the shift of the Phillips curve :