Home /
Expert Answers /
Statistics and Probability /
8-consider-the-following-graph-of-long-term-interest-rates-10-year-treasury-notes-and-inflation-pa734
(Solved): 8. Consider the following graph of long-term interest rates (10-year treasury notes) and inflation ...
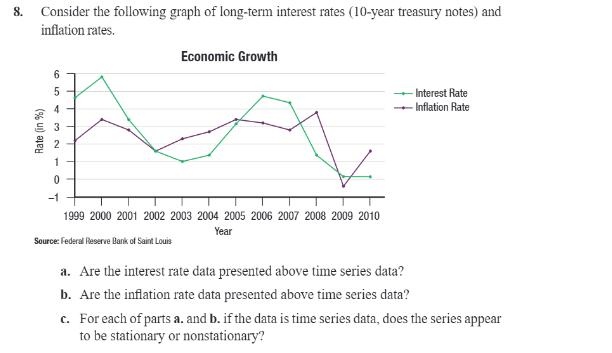
8. Consider the following graph of long-term interest rates (10-year treasury notes) and inflation rates. Rate (in %) 605432 Economic Growth -1 1999 2000 2001 2002 2003 2004 2005 2006 2007 2008 2009 2010 Year Source: Federal Reserve Bank of Saint Louis Interest Rate ???Inflation Rate a. Are the interest rate data presented above time series data? b. Are the inflation rate data presented above time series data? c. For each of parts a. and b. if the data is time series data, does the series appear to be stationary or nonstationary?
Expert Answer
Please don't hesitate to give a thumbs up for the answer in case you're satisfied with it. a. Since on x-