Home /
Expert Answers /
Statistics and Probability /
8-a-two-tailed-hypothesis-test-for-a-repeated-measures-research-design-previous-studies-have-show-pa500
(Solved): 8. A two-tailed hypothesis test for a repeated-measures research design Previous studies have show ...
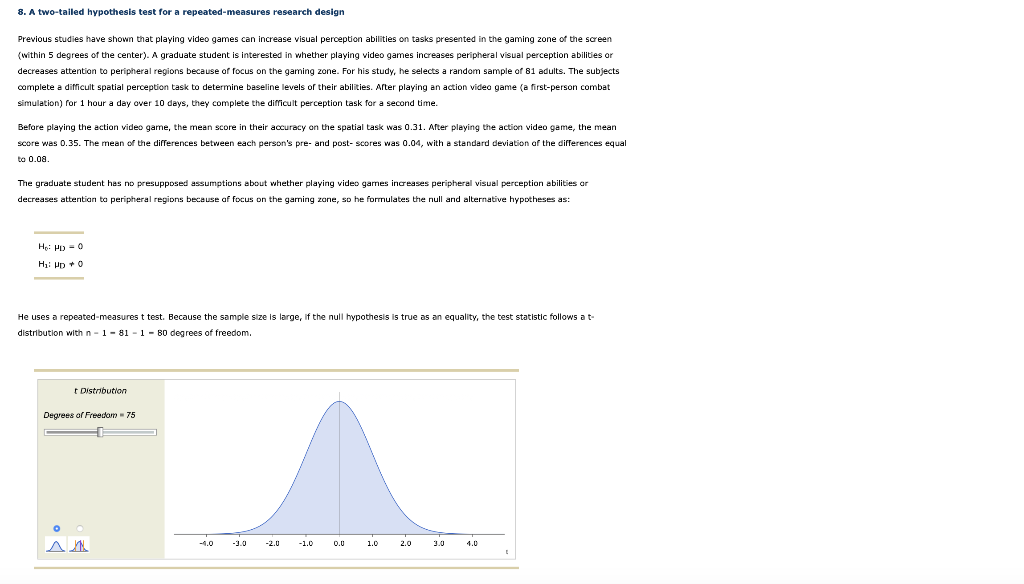
8. A two-tailed hypothesis test for a repeated-measures research design Previous studies have shown that playing video games can increase visual perception abilities on tasks presented in the gaming zone of the screen (within 5 degrees of the center). A graduate student is interested in whether playing video games increases peripheral visual perception abilities or decreases attention to peripheral regions because of focus on the gaming zone. For his study, he selects a random sample of 81 adults. The subjects complete a dificult spatial perception task to determine baseline levels of their abilities. After playing an action video game ?a first-person combat simulation) for 1 hour a day over 10 days, they complete the difficult perception task for a second time. Before playing the action video game, the mean score in their accuracy on the spatial task was 0.31. After playing the action video game, the mean score was 0.35. The mean of the differences between each person's pre- and post-scores was 0.04 , with a standard deviation of the differences equal to 0.08. The graduate student has no presupposed assumptions about whether playing video garmes increases peripheral visual perception abilities or decreases attention to peripheral regions because of focus on the gaming zane, so he formulates the null and alternative hypotheses as: He uses a repeated-measures t test. Because the sample size is large, if the null hypothesis is true as an equality, the test statistic follows a tdistribution with degrees of freedom.
This is a test. Use the Distributions tool to find the critical score(s) for the level of significance . The critical score(s) (the value(s) for t that separate(s) the tail(s) from the main body of the distribution, forming the critical region) is/are To calculate the test statistic, you first need to calculate the estimated standard error under the assumption that the null hypothesis is true. The estimated standard error is The test statistic is Use the tool to evaluate the null hypothesis; using t-tables without exact degrees of freedom may not lead to an answer with enough precision. (Note: You can place the purple line on your t statistic to tell whether it lies within or outside the critical region. It's possible that this line may not rest exactly on the statistic, but you will be able to tell whether it lies within or outside the critical region.) The statistic in the critical region for a two-tailed hypothesis test. Therefore, the null hypothesis is . The graduate student conclude that playing video games alters peripheral visual perception. The graduate student repeats his study with another random sample of the same size. This time, instead of the treatment being playing the combat simulation video game, the treatment is playing a soccer video game. Suppose the results are very similar. After playing a soccer video game, the mean score was still 0.04 higher, but this time the standard deviation of the difference was 0.10 (vs. the original standard deviation of 0.08 ). This means . has the more consistent treatment effect. This difference in the standard deviation also means that a confidence interval of the mean difference would be for the original study, when the treatment was playing the combat simulation video game, than the confidence interval of the mean difference for the second study, when the treatment was playing a soccer video game. Finally, this difference in the standard deviation means that when the graduate student conducts a hypothesis test testing whether the mean difference is zero for the second study, he will be likely to reject the null hypothesis than he was for the hypothesis test you completed previously for the original study.
Expert Answer
ANSWERGeneral guidance:The answer provided below has been developed in a clear step-by-step manner.Degree of freedom: df=n-1=80The test is two-tailed