Home /
Expert Answers /
Biology /
7-the-graph-above-shows-the-immune-response-that-occurs-following-exposure-to-antigen-a-a-base-pa838
(Solved): 7. The graph above shows the immune response that occurs following exposure to antigen A. (a) Base ...
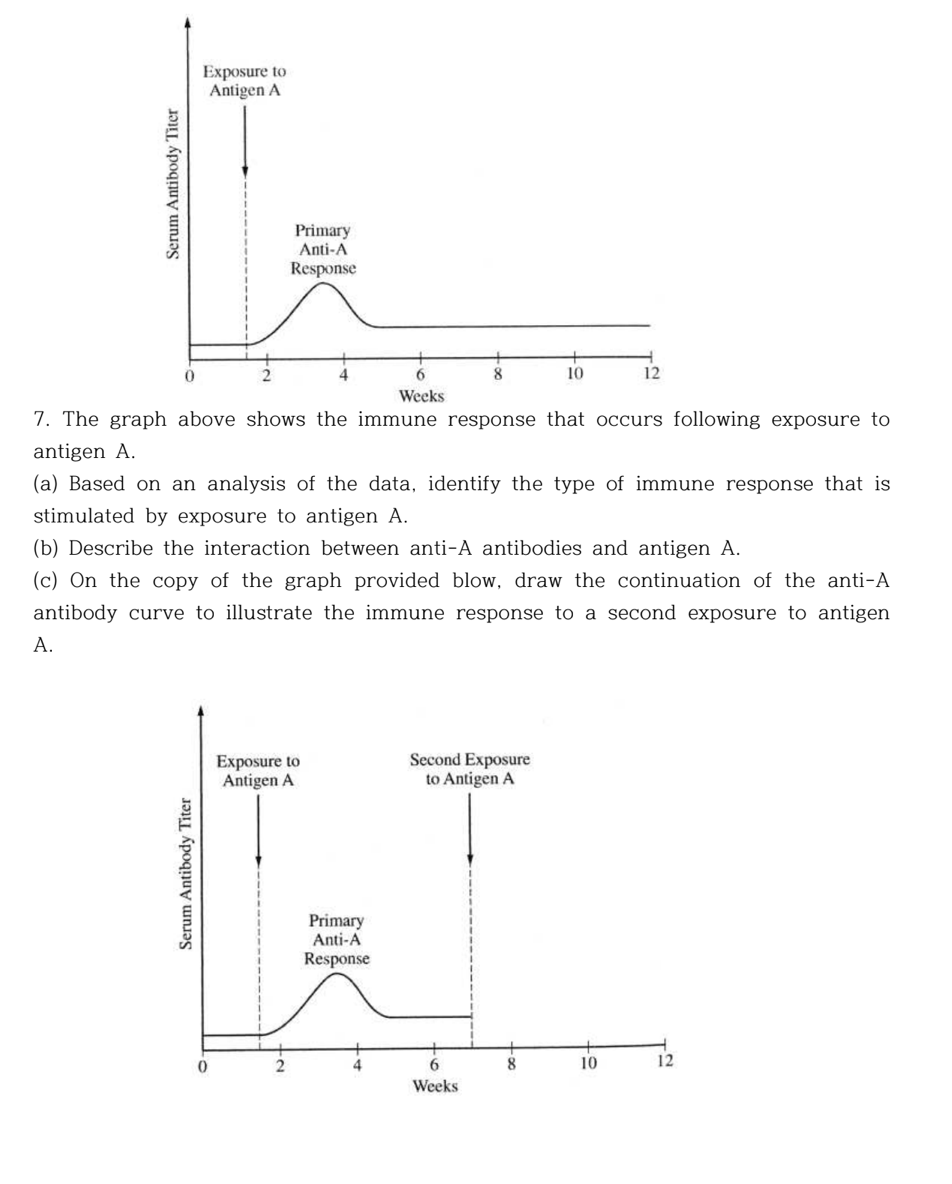
7. The graph above shows the immune response that occurs following exposure to antigen . (a) Based on an analysis of the data, identify the type of immune response that is stimulated by exposure to antigen . (b) Describe the interaction between anti-A antibodies and antigen A. (c) On the copy of the graph provided blow, draw the continuation of the anti-A antibody curve to illustrate the immune response to a second exposure to antigen A.
Expert Answer
(a) When the antigen is first encountered during the main immune response, there is a lag period before the immune system is capable of producing a sizable amount of antigen-specific antibodies or activated T cells.This lag phase is due to the time required for the immune system to recognize the antigen, activate the appropriate immune cells, and produce a large number of specific antibodies. Once the antibodies are produced, they bind to the antigen, neutralizing it or marking it for destruction by other immune cells. The primary immune response typically takes several days to reach its peak and may result in some symptoms of illness.