Home /
Expert Answers /
Other Math /
7-draw-a-histogram-for-the-following-data-daily-high-temperatures-midpoint-class-10-but-less-pa608
(Solved): 7. Draw a histogram for the following data (Daily High Temperatures): Midpoint Class 10 but less ...
7. Draw a histogram for the following data (Daily High Temperatures):
Midpoint
Class
10 but less than 20
20 but less than 30
30 but less than 40
40 but less than 50
50 but less than 60
15
25
35
45
55
Frequency
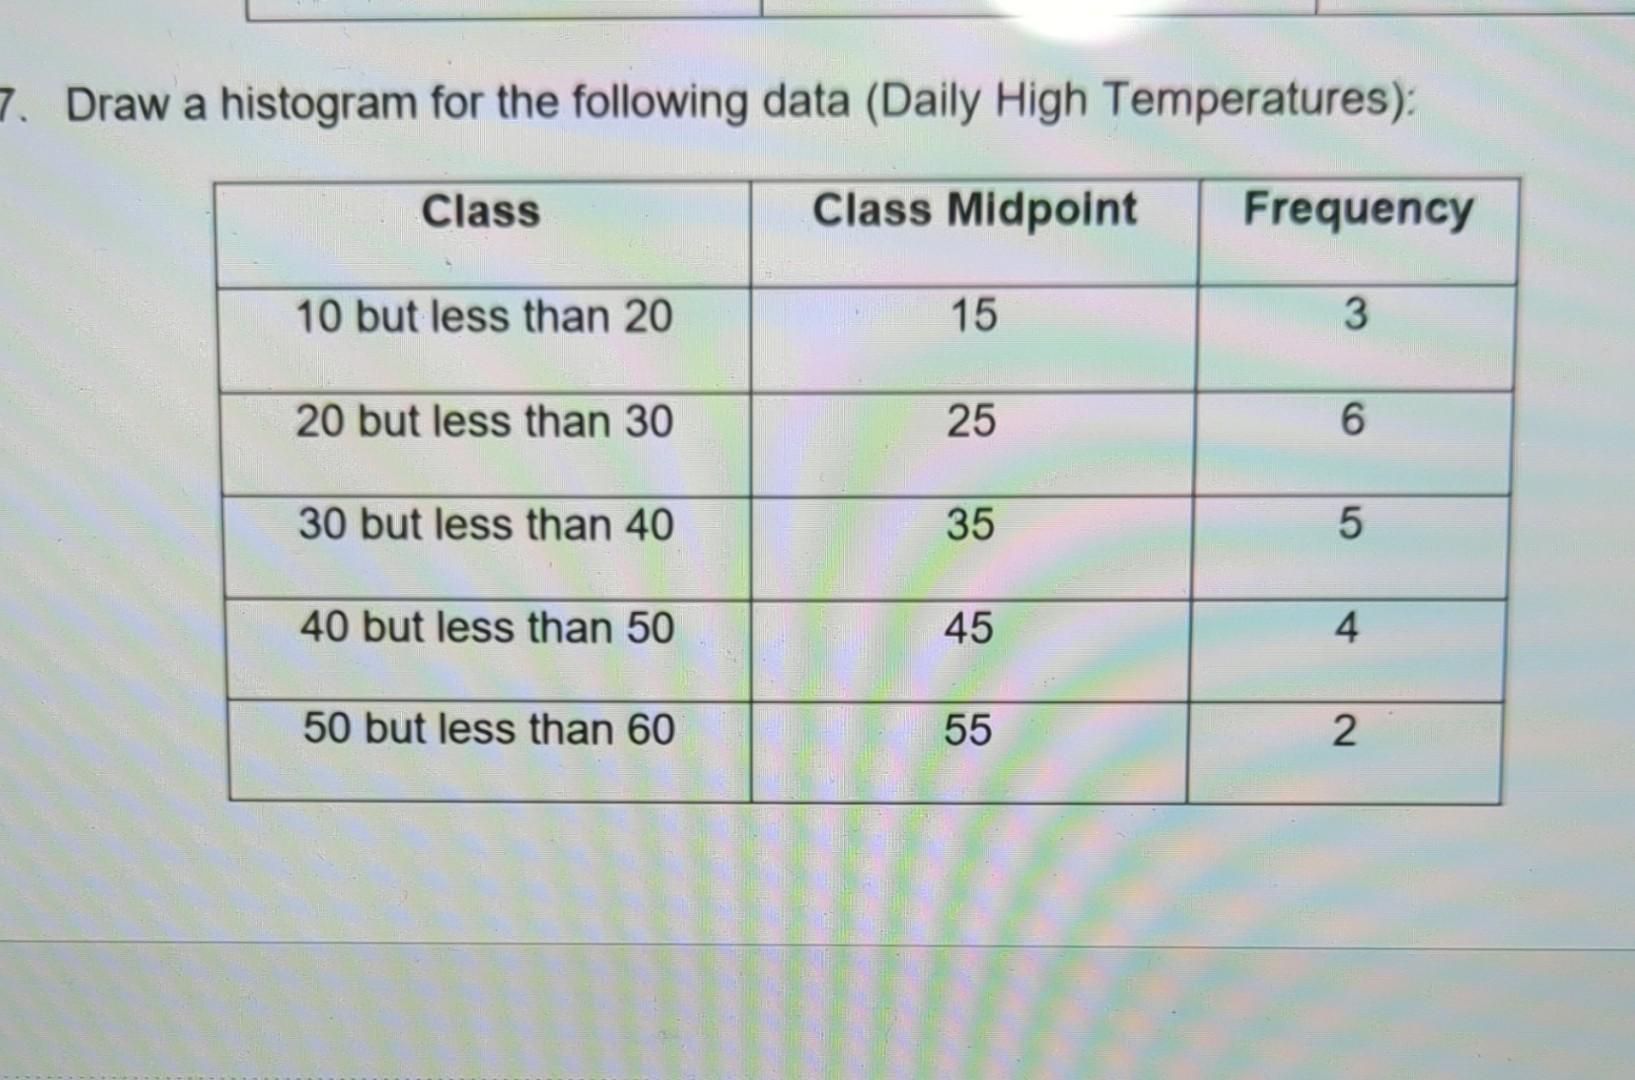
3
6
5
4
2
Draw a histogram for the following data (Daily High Temperatures):