Home /
Expert Answers /
Economics /
7-determinants-of-aggregate-supply-the-following-graph-shows-a-decrease-in-short-run-aggregate-sup-pa868
(Solved): 7. Determinants of aggregate supply The following graph shows a decrease in short-run aggregate sup ...
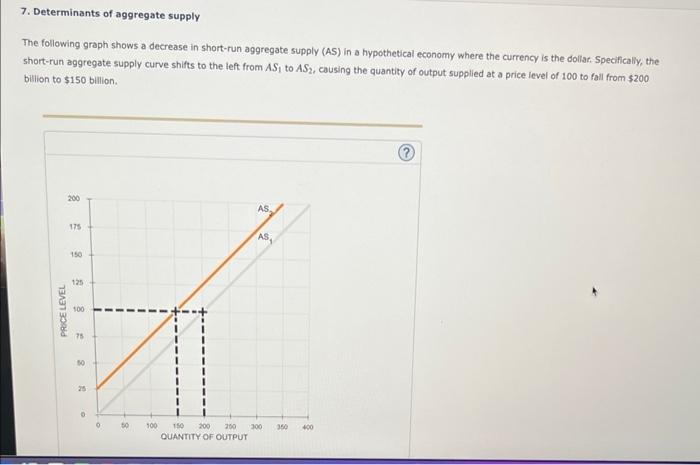
7. Determinants of aggregate supply The following graph shows a decrease in short-run aggregate supply (AS) in a hypothetical economy where the currency is the dollar: Specifically, the short-run aggregate supply curve shifts to the left from \( A S_{1} \) to \( A S_{2} \), causing the quantity of output supplied at a price level of 100 to fall from \( \$ 200 \) billion to \( \$ 150 \) billion.
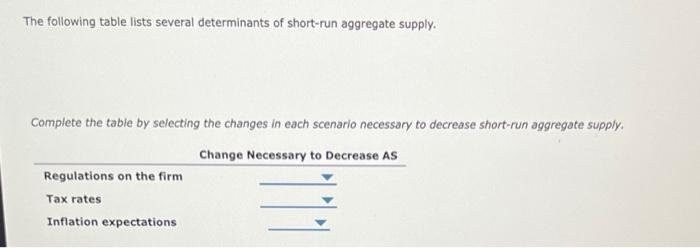
The following table lists several determinants of short-run aggregate supply. Complete the table by selecting the changes in each scenario necessary to decrease short-run aggregate supply.
Expert Answer
Answer Necessary changes to decrease s