Home /
Expert Answers /
Calculus /
64-inflation-the-following-graph-shows-the-approximate-value-of-the-u-s-consumer-price-index-cp-pa181
(Solved): 64. INFLATION The following graph shows the approximate value of the U.S. Consumer Price Index (CP ...
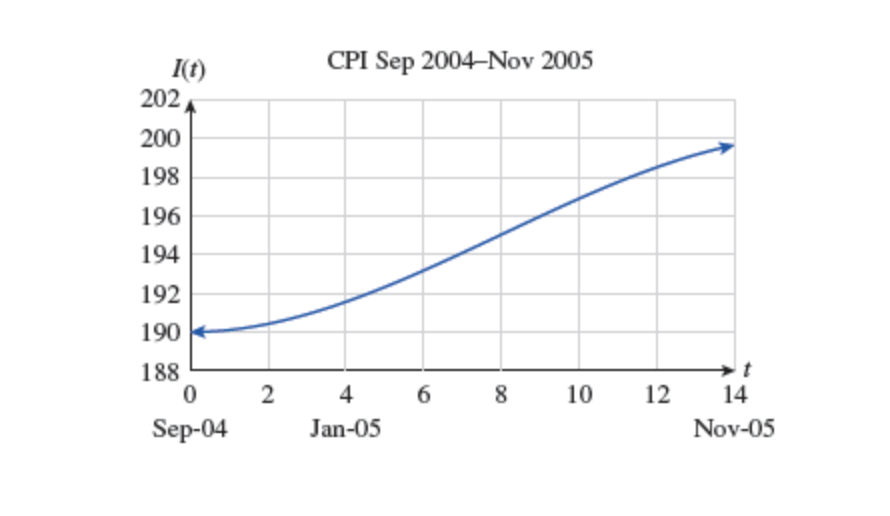
64. INFLATION The following graph shows the approximate value of the U.S. Consumer Price Index (CPI) from September 2004 through November 2005:
The approximating curve shown on the figure is given by I?(t)=-0.005t3+0.12t2-0.01t+190(0?t?14), where t is time in months since the start of September 2004.
a. Use the model to estimate the monthly inflation rate in July 2005 (t=10) . [Recall that the inflation rate is I??(t)?I?(t) .]
b. Was inflation slowing or speeding up in July 2005?
c. When was inflation speeding up? When was inflation slowing? [HINT: See Example 3.]
Expert Answer
The approximating curve is given which describes the inflation from th