Home /
Expert Answers /
Economics /
6-determinants-of-supply-the-following-graph-shows-the-supply-curve-for-sedans-in-an-imaginary-mar-pa709
(Solved): 6. Determinants of supply The following graph shows the supply curve for sedans in an imaginary mar ...
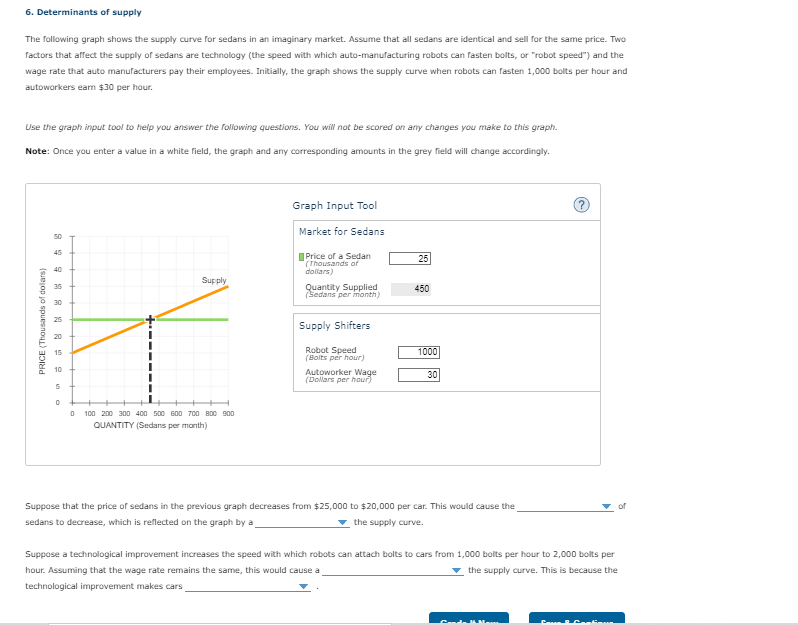
6. Determinants of supply The following graph shows the supply curve for sedans in an imaginary market. Assume that all sedans are identical and sell for the same price. Two factors that affect the supply of sedans are technology (the speed with which auto-manufacturing robots can fasten bolts, or "robot speed") and the wage rate that auto manufacturers pay their employees. Initially, the graph shows the supply curve when robots can fasten 1,000 bolts per hour and autoworkers earn per hour. Use the graph input tool to help you answer the following questions. You will not be scored on any changes you make to this graph. Note: Once you enter a value in a white field, the graph and any corresponding amounts in the grey field will change accordingly. Graph Input Tool Market for Sedans Price of a Sedan ('Thousands of dollars) Quantity Supplied (Sedsns per month) Supply Shifters Robot Speed (Boits per hour) Autoworker Wage (Dowlars per hour) Suppose that the price of sedans in the previous graph decreases from to per car. This would cause the of sedans to decrease, which is reflected on the graph by a the supply curve. Suppose a technological improvement increases the speed with which robots can attach bolts to cars from 1,000 bolts per hour to 2,000 bolts per hour. Assuming that the wage rate remains the same, this would cause a the supply curve. This is because the technological improvement makes cars