(Solved): 6 and S6 Part 1 of 8 Completed: 1 of 6 | My score: 0.33/6 pts (5.56%) Save Refer to Lable S6.1 - Fac ...
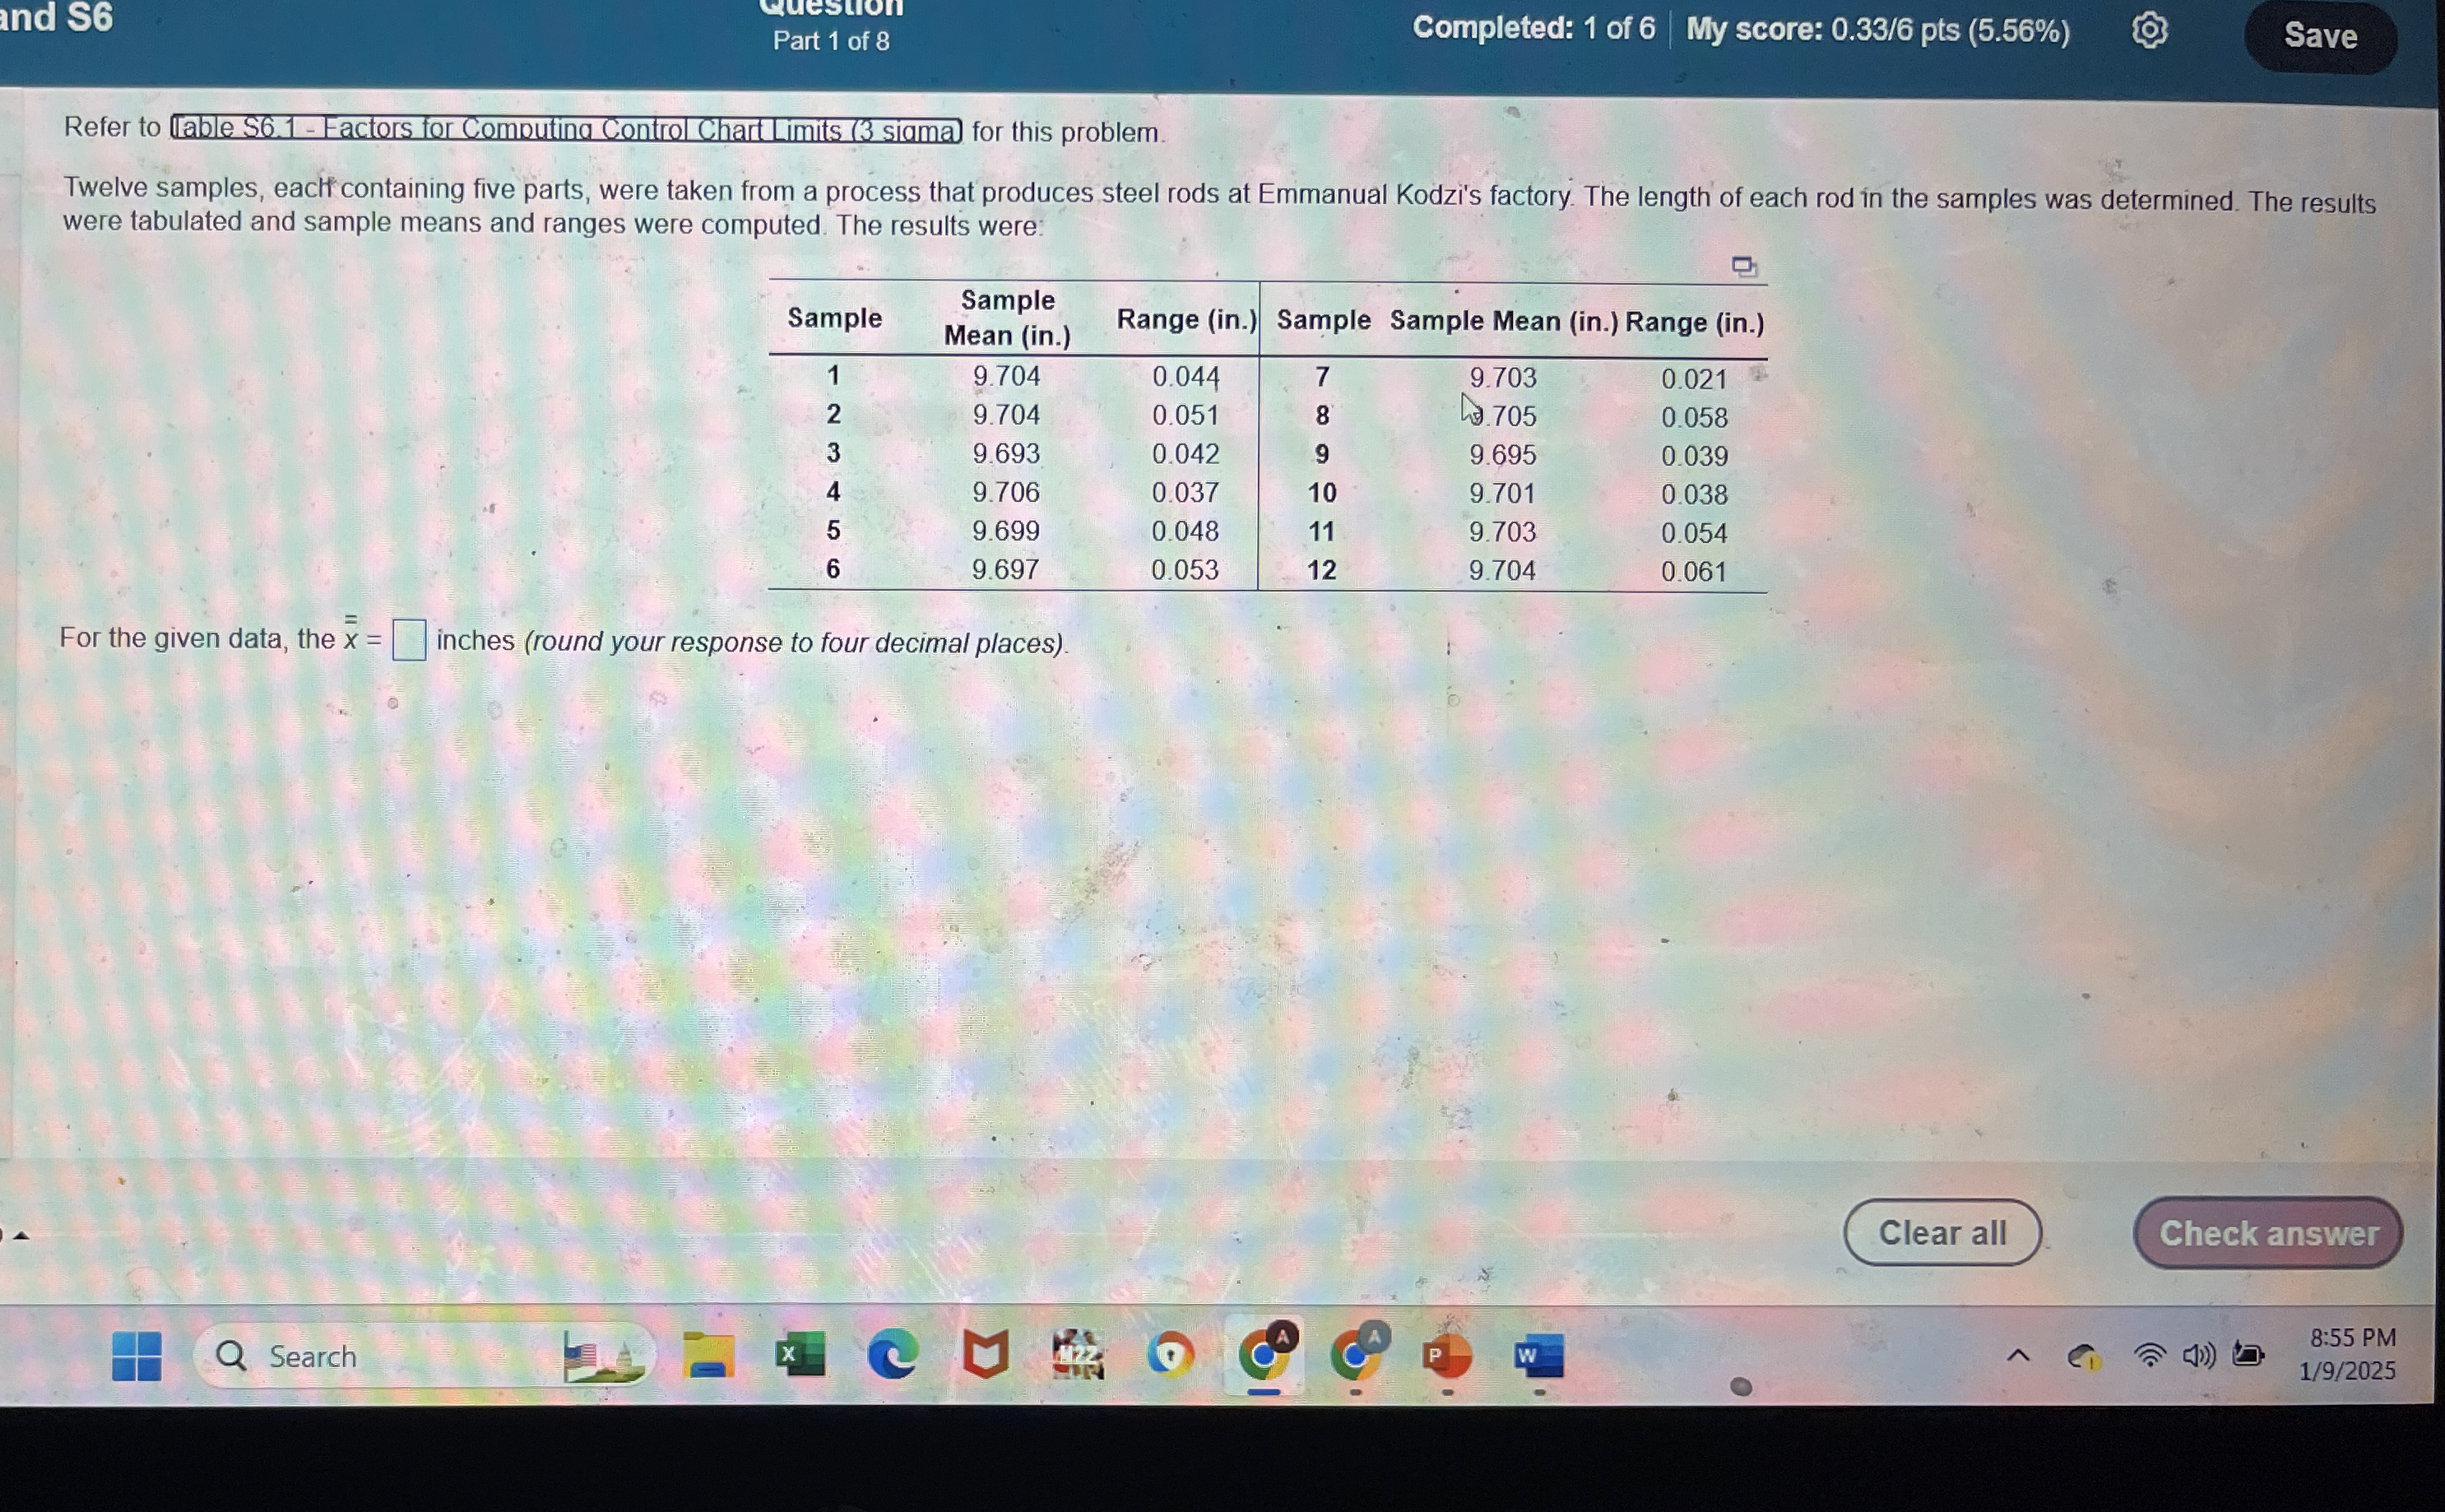
6 and S6 Part 1 of 8 Completed: 1 of 6 | My score: 0.33/6 pts (5.56%) Save Refer to Lable S6.1 - Factors for Comoutina Control ChartLimits (3 siama for this problem. Twelve samples, eaclf containing five parts, were taken from a process that produces steel rods at Emmanual Kodzi's factory. The length of each rod in the samples was determined. The results were tabulated and sample means and ranges were computed. The results were: \table[[Sample,\table[[Sample],[Mean (in.)]],Range (in.),Sample,Sample Mean (in.) Range (in.),],[
1,9.704,0.044,
7,9.703,0.021],[
2,9.704,0.051,
8,9.705,0.058],[
3,9.693,0.042,
9,9.695,0.039],[
4,9.706,0.037,
10,9.701,0.038],[
5,9.699,0.048,
11,9.703,0.054],[
6,9.697,0.053,
12,9.704,0.061]] For the given data, the
/bar (\bar{x} )=
?inches (round your response to four decimal places). Search 8:54 PM 1/9/2025 Question Part 1 of 8 e S6.1 - Factors for Computing Control Chart Limits (3 sigma) for this problem. Definition \table[[\table[[Sample],[Size,
n