Home /
Expert Answers /
Biology /
51-refer-to-the-graph-below-which-shows-npp-changes-during-forest-succession-curve-a-of-the-grap-pa234
(Solved): 51. Refer to the graph below, which shows NPP changes during forest succession. Curve A of the grap ...
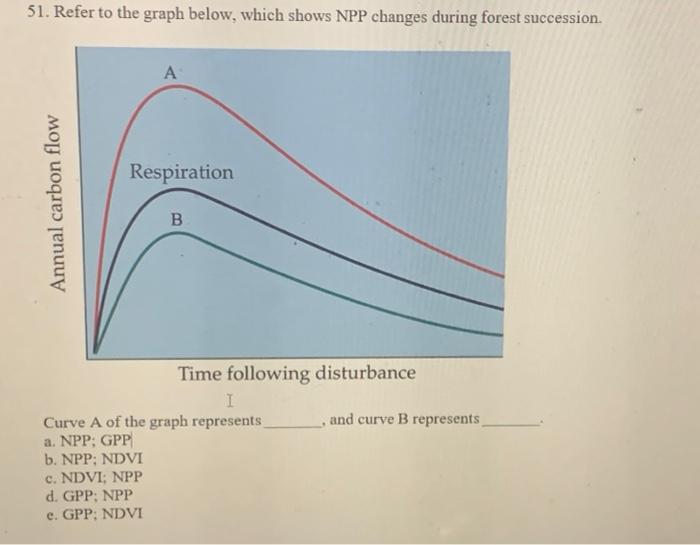
51. Refer to the graph below, which shows NPP changes during forest succession. Curve A of the graph represents , and curve B represents a. NPP; GPP' b. NPP; NDVI c. NDVI; NPP d. GPP; NPP e. GPP; NDVI
Expert Answer
The time following disturbance Curve A of the graph represents NPP and Curve B represents GPP.