Home /
Expert Answers /
Chemical Engineering /
50-pts-refer-to-the-psychometric-chart-on-the-next-page-and-the-following-meteorological-data-pa338
(Solved): (50 pts). Refer to the psychometric chart on the next page, and the following meteorological data. ...


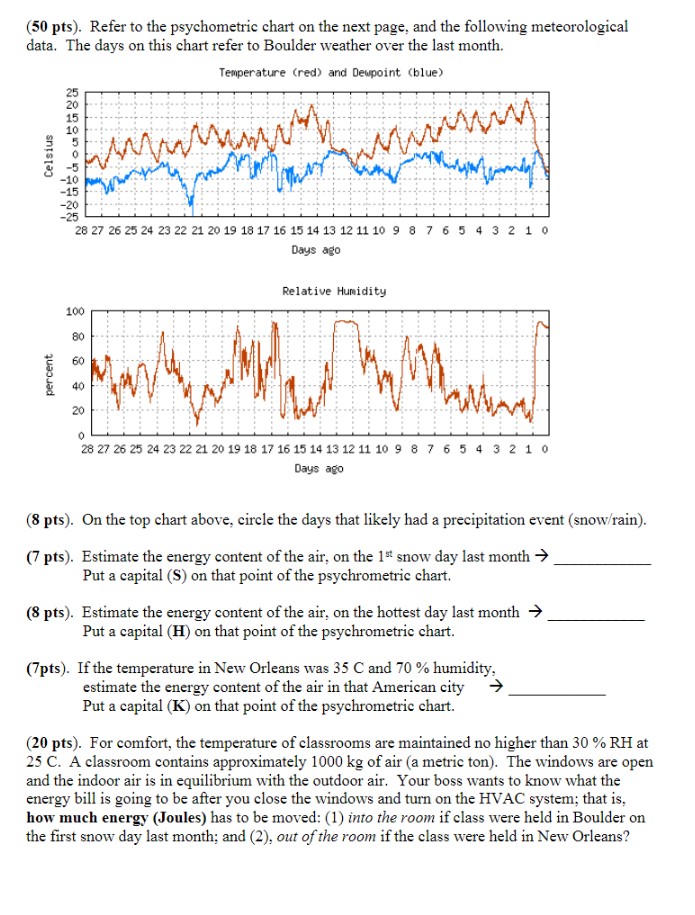
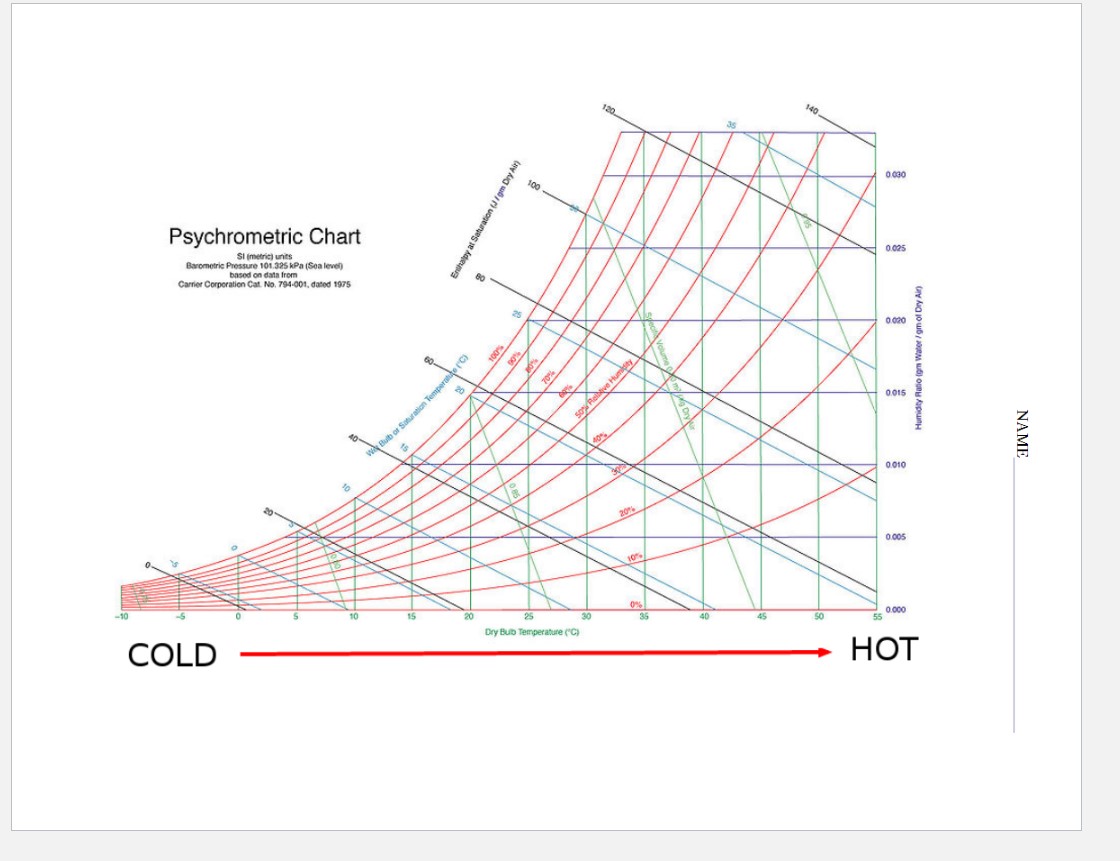
(50 pts). Refer to the psychometric chart on the next page, and the following meteorological data. The days on this chart refer to Boulder weather over the last month. (8 pts). On the top chart above, circle the days that likely had a precipitation event (snow/rain). (7 pts). Estimate the energy content of the air, on the snow day last month Put a capital (S) on that point of the psychrometric chart. (8 pts). Estimate the energy content of the air, on the hottest day last month Put a capital on that point of the psychrometric chart. (7pts). If the temperature in New Orleans was and humidity, estimate the energy content of the air in that American city Put a capital (K) on that point of the psychrometric chart. (20 pts). For comfort, the temperature of classrooms are maintained no higher than at . A classroom contains approximately of air (a metric ton). The windows are open and the indoor air is in equilibrium with the outdoor air. Your boss wants to know what the energy bill is going to be after you close the windows and turn on the HVAC system; that is, how much energy (Joules) has to be moved: (1) into the room if class were held in Boulder on the first snow day last month; and (2), out of the room if the class were held in New Orleans?
Expert Answer
To circle the days that likely had a precipitation event (snow/rain), we need information about the specific days and the corresponding temperature and dewpoint data. Unfortunately, the temperature and dewpoint values you provided are not associated ...