Home /
Expert Answers /
Biology /
5-what-type-of-data-is-shown-in-the-graph-below-please-choose-all-the-appropriate-categories-pa126
(Solved): 5) What type of data is shown in the graph below. Please choose all the appropriate categories. - ...
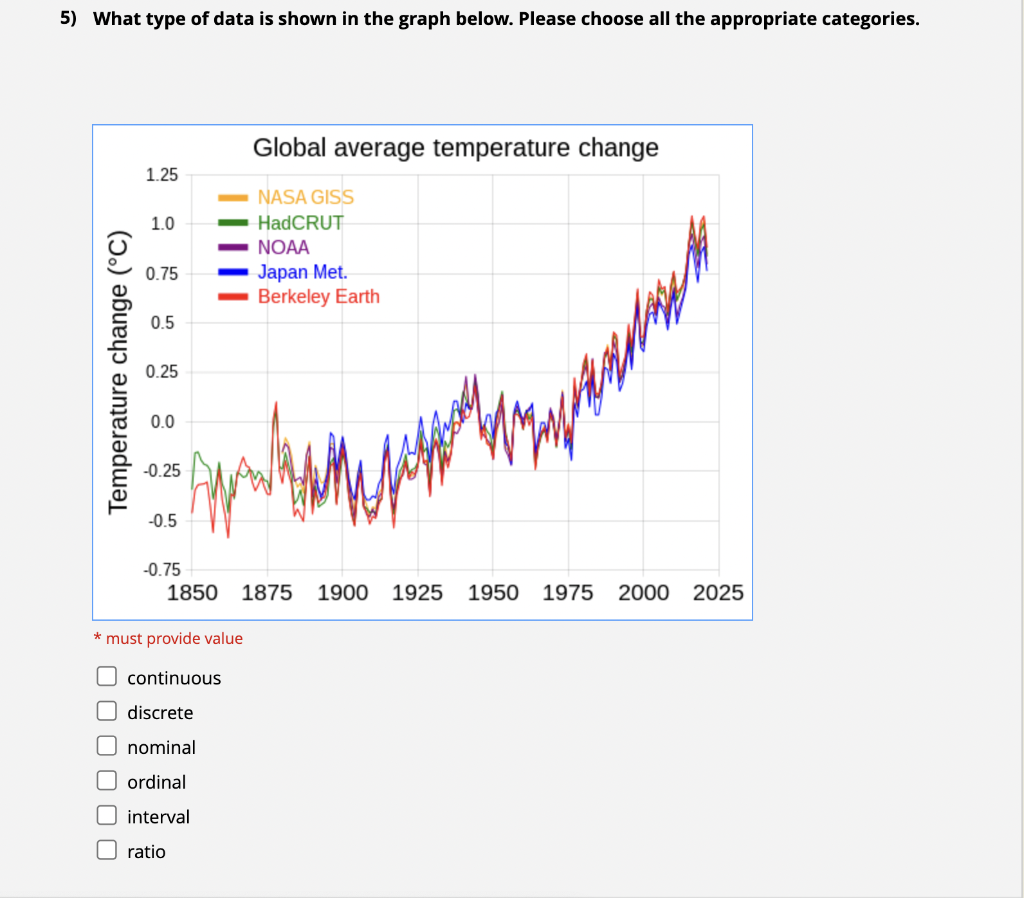
5) What type of data is shown in the graph below. Please choose all the appropriate categories. - Illust pruviue value continuous discrete nominal ordinal interval ratio
6) You are provided with data on the heights of 100 different Acacia trees. What type of graph would be best to use to display this data? * must provide value line graph box plot histogram bar chart scatterplot
Expert Answer
SOLUTION 5 :- - In the given question We are provided with the data where yearly temperature is recorded . - The Discrete data is that values which are certain taking only the specific values whereas co

