Home /
Expert Answers /
Advanced Math /
5-the-scatter-plot-below-represents-the-depth-of-water-in-a-tidal-area-over-a-24-hour-period-a-d-pa497
(Solved): 5. The scatter plot below represents the depth of water in a tidal area over a 24-hour period. a. D ...
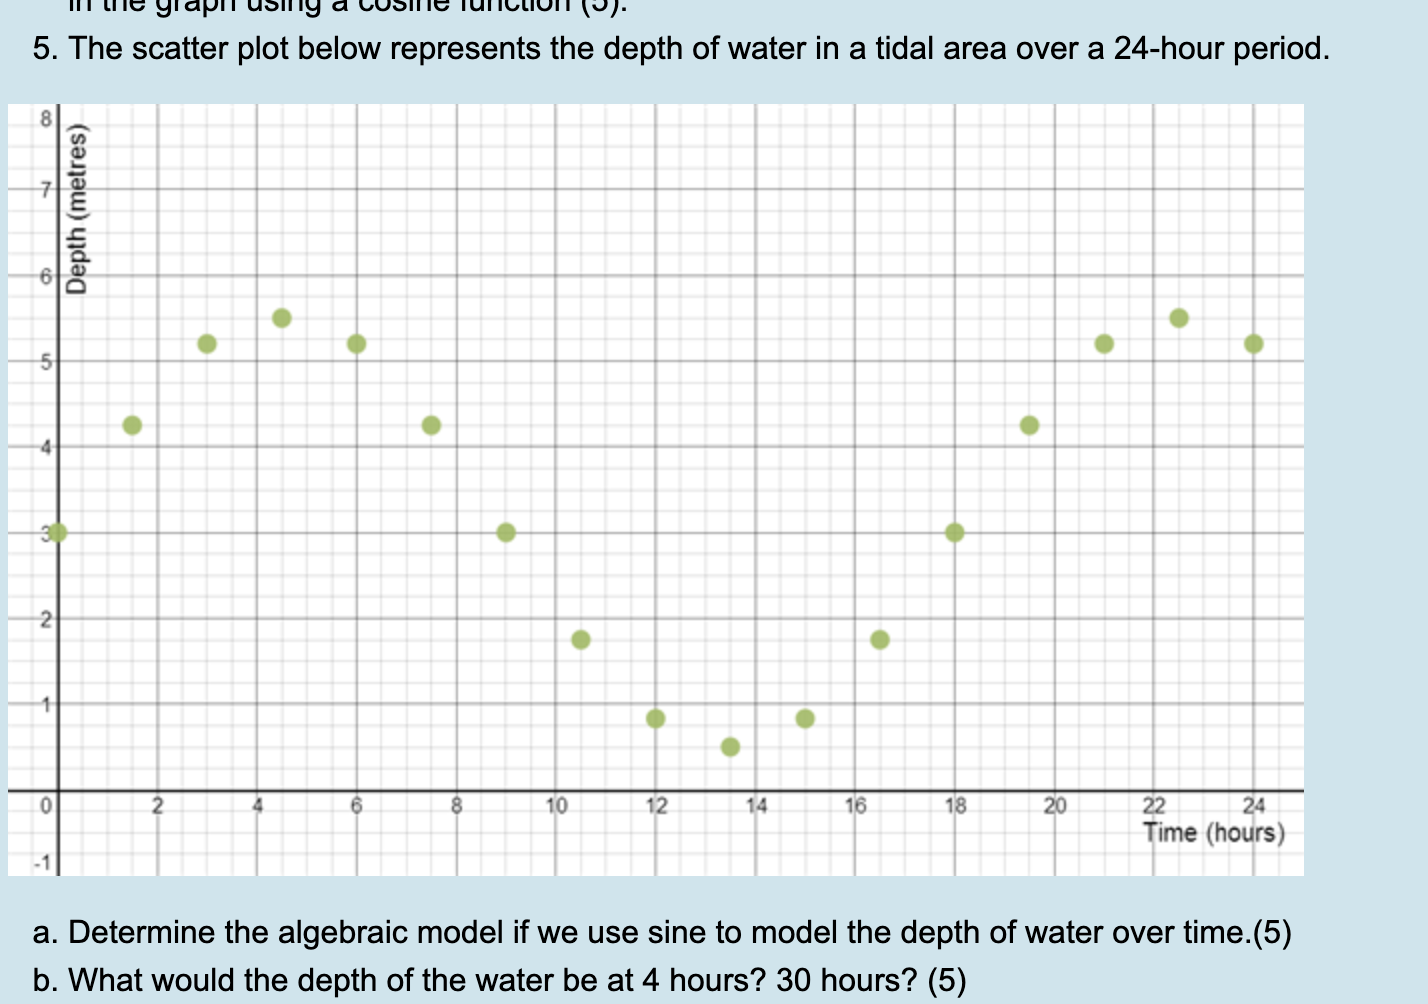
5. The scatter plot below represents the depth of water in a tidal area over a 24-hour period. a. Determine the algebraic model if we use sine to model the depth of water over time.(5) b. What would the depth of the water be at 4 hours? 30 hours? (5)
Expert Answer
The equation of a sine function is represented as Based on the graph, we can determine the highe...