Home /
Expert Answers /
Chemical Engineering /
5-nbsp-the-figure-below-shows-the-ir-spectrum-of-an-organic-molecule-i-nbsp-you-were-told-that-th-pa797
(Solved): 5. The figure below shows the IR spectrum of an organic molecule. i) You were told that th ...
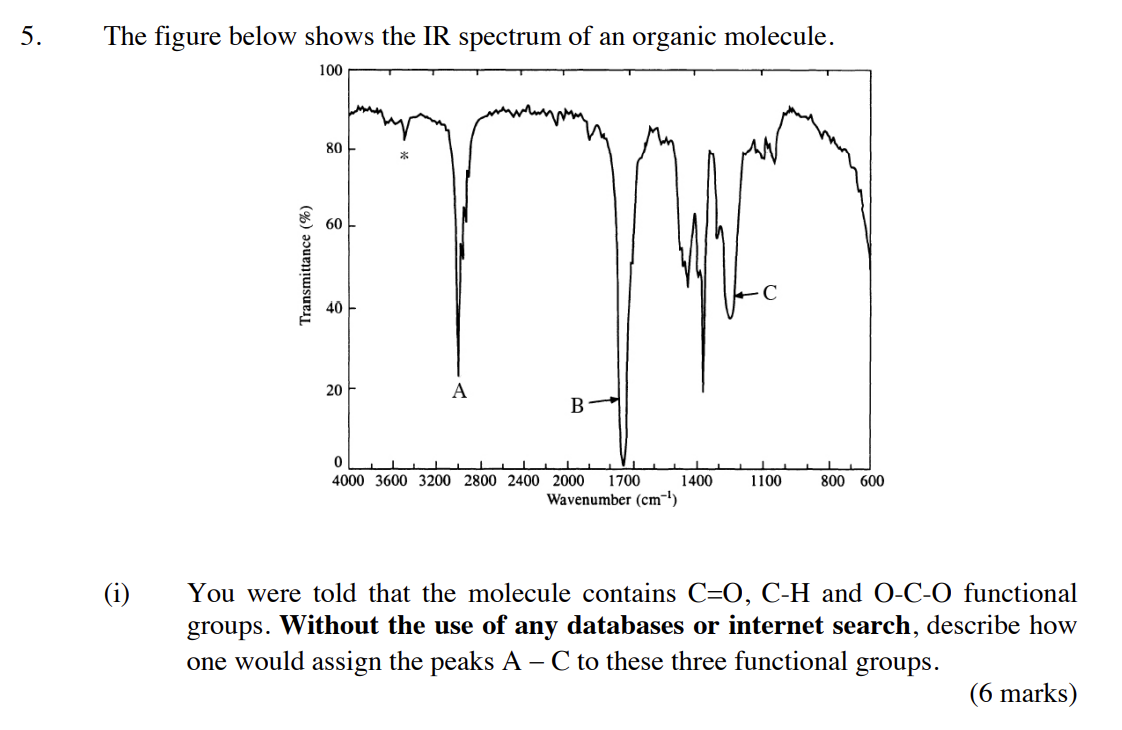
5. The figure below shows the IR spectrum of an organic molecule.
i) You were told that the molecule contains C=O, C-H and O-C-O functional groups. Without the use of any databases or internet search, describe how one would assign the peaks A - C to these three functional groups.
ii) ) What could be the peak marked (*)? Explain the origins of this peak.
The figure below shows the IR spectrum of an organic molecule. (i) You were told that the molecule contains \( \mathrm{C}=\mathrm{O}, \mathrm{C}-\mathrm{H} \) and \( \mathrm{O}-\mathrm{C}-\mathrm{O} \) functional groups. Without the use of any databases or internet search, describe how one would assign the peaks \( \mathrm{A}-\mathrm{C} \) to these three functional groups. (6 marks)
(ii) What could be the peak marked \( (*) \) ? Explain the origins of this peak.
Expert Answer
i) Peak A (2900cm-1) corresponds to C-H strech. Peak at B(1700

