Home /
Expert Answers /
Economics /
5-categorizing-the-expenditure-and-resource-cost-income-approaches-the-following-table-shows-macro-pa500
(Solved): 5. Categorizing the expenditure and resource cost-income approaches The following table shows macro ...

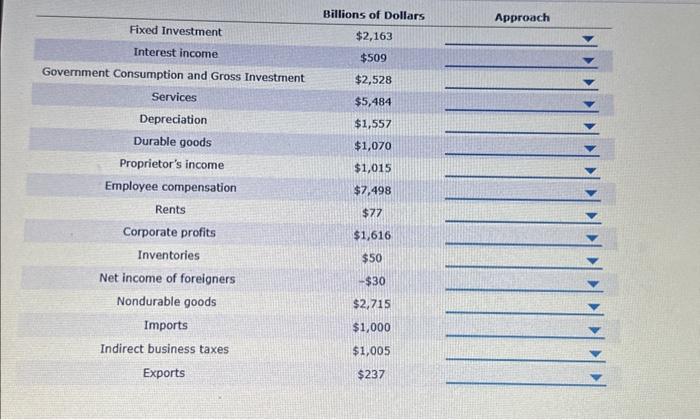
5. Categorizing the expenditure and resource cost-income approaches The following table shows macroeconomic data for an imaginary economy. All figures are in billions of dollars. For each account, identify which approach uses it to denve GDP by selecting either Expenditure or Resoruce Cost-Income in the Approach column.
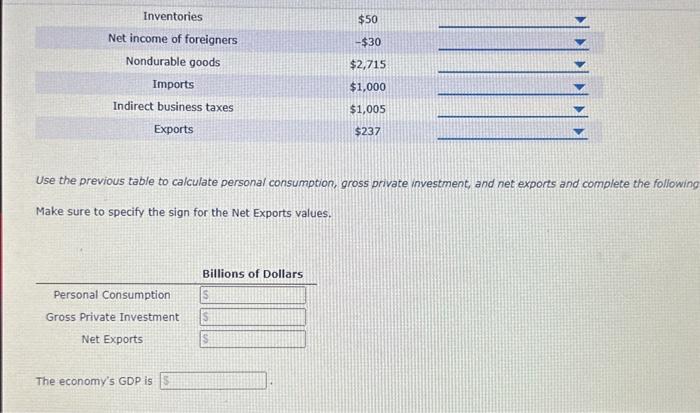
\begin{tabular}{|c|c|c|} \hline & Billions of Dollars & Approach \\ \hline Fixed Investment & & \\ \hline Interest income & & \\ \hline Government Consumption and Gross Investment & & \\ \hline Services & & \\ \hline Depreciation & & \\ \hline Durable goods & & \\ \hline Proprietor's income & & \\ \hline Employee compensation & & \\ \hline Rents & & \\ \hline Corporate profits & & \\ \hline Inventories & & \\ \hline Net income of foreigners & & \\ \hline Nondurable goods & & \\ \hline Imports & & \\ \hline Indirect business taxes & & \\ \hline Exports & & \\ \hline \end{tabular}
Use the previous table to calculate personal consumption, gross private investment, and net exports and complete the following Make sure to specify the sign for the Net Exports values.