Home /
Expert Answers /
Advanced Physics /
4-the-diagram-shows-the-graphs-of-the-stopping-potential-as-a-function-of-the-frequency-of-the-in-pa492
(Solved): 4. The diagram shows the graphs of the stopping potential as a function of the frequency of the in ...
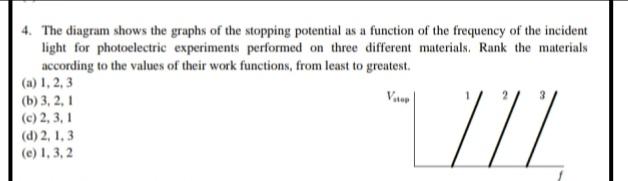
4. The diagram shows the graphs of the stopping potential as a function of the frequency of the incident light for photoelectric experiments performed on three different materials. Rank the materials according to the values of their work functions, from least to greatest. (a) (b) (c) 2, 3, 1 (d) 2, 1, 3 (e)
Expert Answer
The graphs of the stopping potential (Vstop) as the function of the frequency of the incident light (f) for the photoelectric experiments performed on