Home /
Expert Answers /
Economics /
4-profit-maximization-in-the-cost-curve-diagram-the-following-graph-plots-daily-cost-curves-for-a-pa701
(Solved): 4. Profit maximization in the cost-curve diagram The following graph plots daily cost curves for a ...
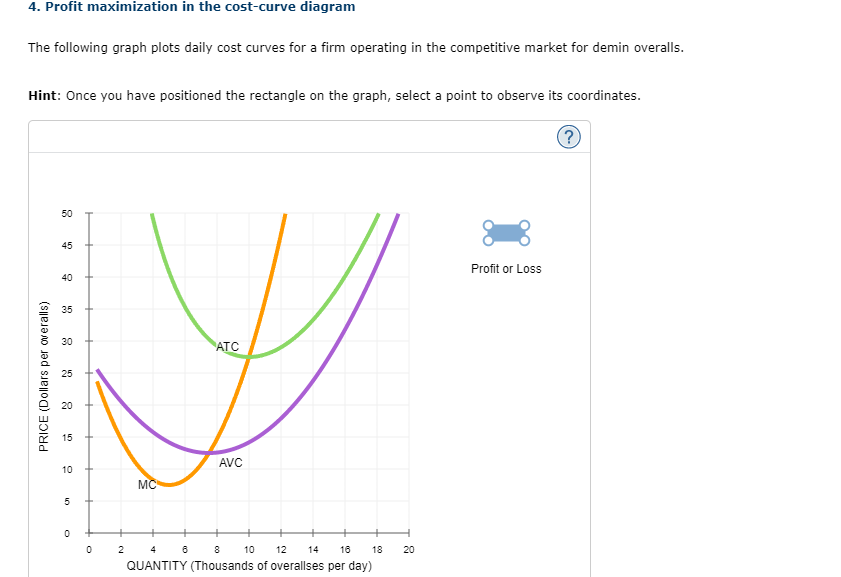
4. Profit maximization in the cost-curve diagram The following graph plots daily cost curves for a firm operating in the competitive market for demin overalls. Hint: Once you have positioned the rectangle on the graph, select a point to observe its coordinates.
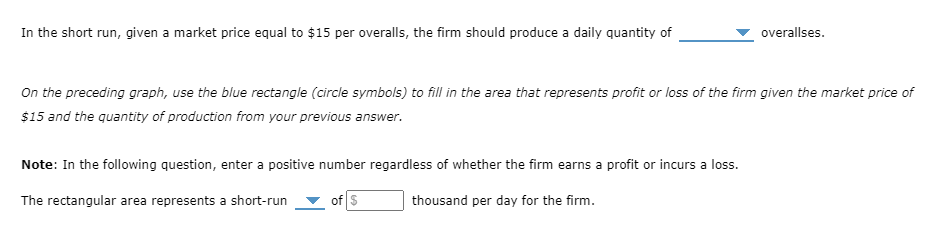
In the short run, given a market price equal to \( \$ 15 \) per overalls, the firm should produce a daily quantity of overallses. On the preceding graph, use the blue rectangle (circle symbols) to fill in the area that represents profit or loss of the firm given the market price of \( \$ 15 \) and the quantity of production from your previous answer. Note: In the following question, enter a positive number regardless of whether the firm earns a profit or incurs a loss. The rectangular area represents a short-run of thousand per day for the firm.