Home /
Expert Answers /
Mechanical Engineering /
4-figure-below-shows-an-electric-log-the-log-displays-several-normal-and-lateral-curves-16-inch-pa730
(Solved): 4. Figure below shows an electric log. The log displays several normal and lateral curves (16-inch ...
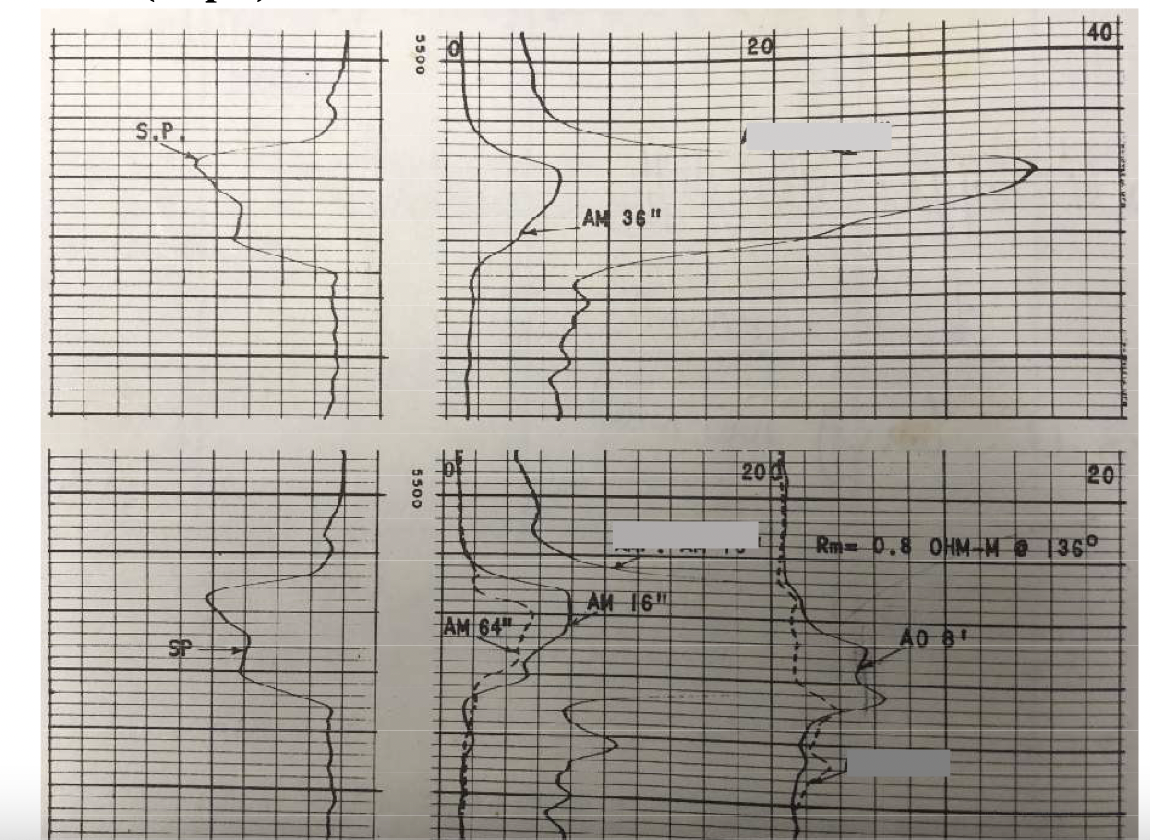
4. Figure below shows an electric log. The log displays several normal and lateral curves (16-inch short normal; 36-inch normal; 64-inch long normal; 8-ft lateral) obtained for a resistive, 22-ft sand surrounded by thick shales. Please write down the readings from the different log curves, and state which reading is the best estimate of the true resistivity of the
S.P. 5500 5500 0 AM 64" AM 36" AM 16 20 200 IV 40 AD 81 20 Rm- 0.8 OHM-M@ 136°
Expert Answer
During the first quarter century of well logging, the only electrical surveys (ES) available were the resistivity logs made with so-called lateral and normal devices plus the SP. Thousands of them were run each year all over the world. Since then, ne

