Home /
Expert Answers /
Economics /
4-assume-that-the-accompanying-graph-depicts-aggregate-supply-and-demand-conditions-in-an-economy-pa312
(Solved): 4- Assume that the accompanying graph depicts aggregate supply and demand conditions in an economy. ...
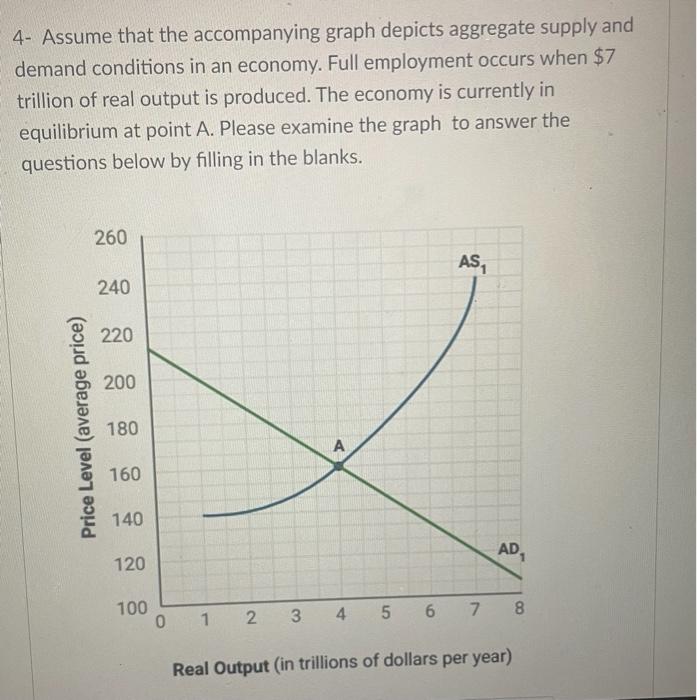
4- Assume that the accompanying graph depicts aggregate supply and demand conditions in an economy. Full employment occurs when $7 trillion of real output is produced. The economy is currently in equilibrium at point A. Please examine the graph to answer the questions below by filling in the blanks. Price Level (average price) 260 240 220 200 180 160 140 120 100 0 A 1 AS? AD1 2 3 4 5 6 7 8 Real Output (in trillions of dollars per year)
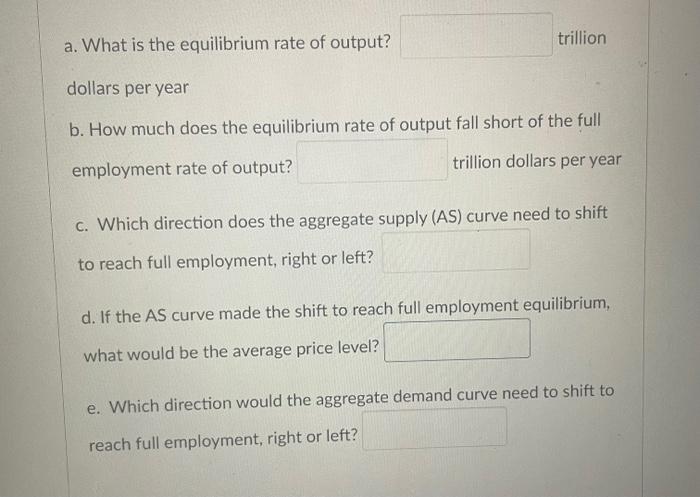
trillion a. What is the equilibrium rate of output? dollars per year b. How much does the equilibrium rate of output fall short of the full employment rate of output? trillion dollars per year c. Which direction does the aggregate supply (AS) curve need to shift to reach full employment, right or left? d. If the AS curve made the shift to reach full employment equilibrium, what would be the average price level? e. Which direction would the aggregate demand curve need to shift to reach full employment, right or left?
Expert Answer
Answer A) 4 answer B) 3 explan