Home /
Expert Answers /
Civil Engineering /
4-a-soil-profile-is-shown-in-the-following-figure-a-calculate-the-over-consolidation-ratio-at-pa944
(Solved): (4) A soil profile is shown in the following figure. (a) Calculate the Over Consolidation Ratio at ...
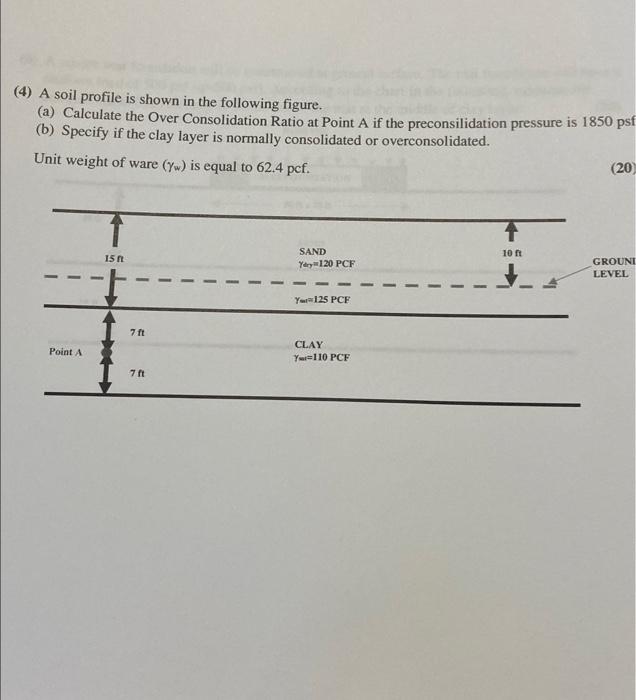
(4) A soil profile is shown in the following figure. (a) Calculate the Over Consolidation Ratio at Point \( \mathrm{A} \) if the preconsilidation pressure is \( 1850 \mathrm{ps} \) (b) Specify if the clay layer is normally consolidated or overconsolidated. Unit weight of ware \( \left(\gamma_{w}\right) \) is equal to \( 62.4 \) pcf.
Expert Answer
effective pressure at point A= 10*