Home /
Expert Answers /
Economics /
3-using-the-midpoint-method-the-following-graph-shows-two-known-points-x-and-y-on-a-demand-curve-pa566
(Solved): 3. Using the midpoint method The following graph shows two known points (X and Y) on a demand curve ...
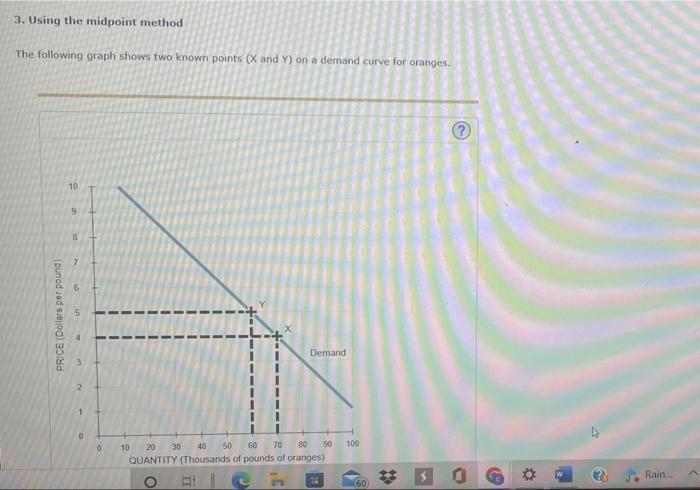

3. Using the midpoint method The following graph shows two known points (X and Y) on a demand curve for oranges. 10 9 Demand 10 20 70 40 30 50 60 80 90 QUANTITY (Thousands of pounds of oranges) H PRICE (Dollars per pound): 8 2 1 0 0 O 100 (60) # O C Ö 2 Rain....
According to the midpoint method, the price elasticity of demand for oranges between point X and point Y is approximately the demand for oranges is which suggests that between points X and Y.
Expert Answer
Introduction Making use of what is provided we have, Expla