Home /
Expert Answers /
Economics /
3-using-the-midpoint-method-the-following-graph-shows-two-known-points-x-and-v-on-a-demand-curv-pa174
(Solved): 3. Using the midpoint method The following graph shows two known points (X and V) on a demand curv ...
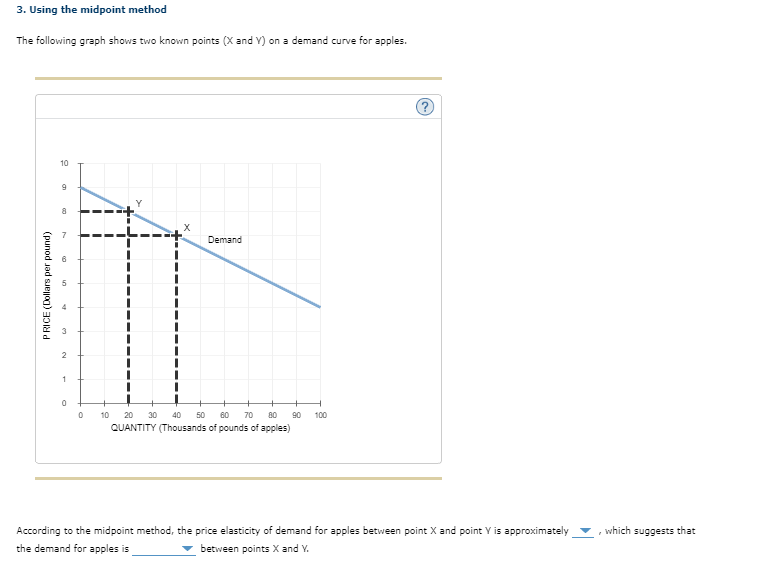
3. Using the midpoint method The following graph shows two known points (X and V) on a demand curve for apples. 10 9 8 Demand PRICE (Dollars per pound) 1 0 (2?) 0 10 20 30 40 50 60 70 80 90 100 QUANTITY (Thousands of pounds of apples) According to the midpoint method, the price elasticity of demand for apples between point X and point Y is approximately the demand for apples is ? between points X and Y. which suggests that
Expert Answer
Answer : the price elasticity of demand for apples between point X and point Y is approximately 5 and the demand for appl