Home /
Expert Answers /
Biology /
3-the-following-figure-shows-a-dose-response-curve-that-defines-the-role-of-pa560
(Solved): 3. The following figure shows a dose-response curve that defines the role of ...

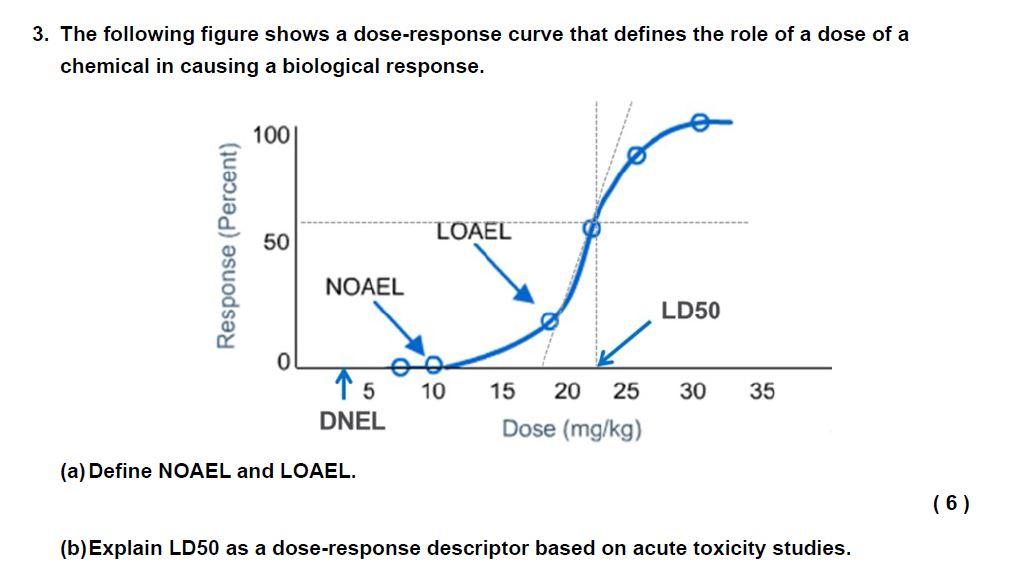
3. The following figure shows a dose-response curve that defines the role of a dose of a chemical in causing a biological response. (a) Define NOAEL and LOAEL. (b) Explain LD50 as a dose-response descriptor based on acute toxicity studies.
Expert Answer
Answer (a) They are defined as follows: NOAEL -- Highest dose at which there was not an observed toxic or adverse effect. LOAEL -- Lowest dose at whic