Home /
Expert Answers /
Computer Science /
2d-plot-2d-plots-are-the-simplest-plots-the-axes-can-define-a-2d-cartesian-coordinate-system-or-a-pa469
(Solved): 2D Plot 2D plots are the simplest plots. The axes can define a 2D Cartesian coordinate system or a ...
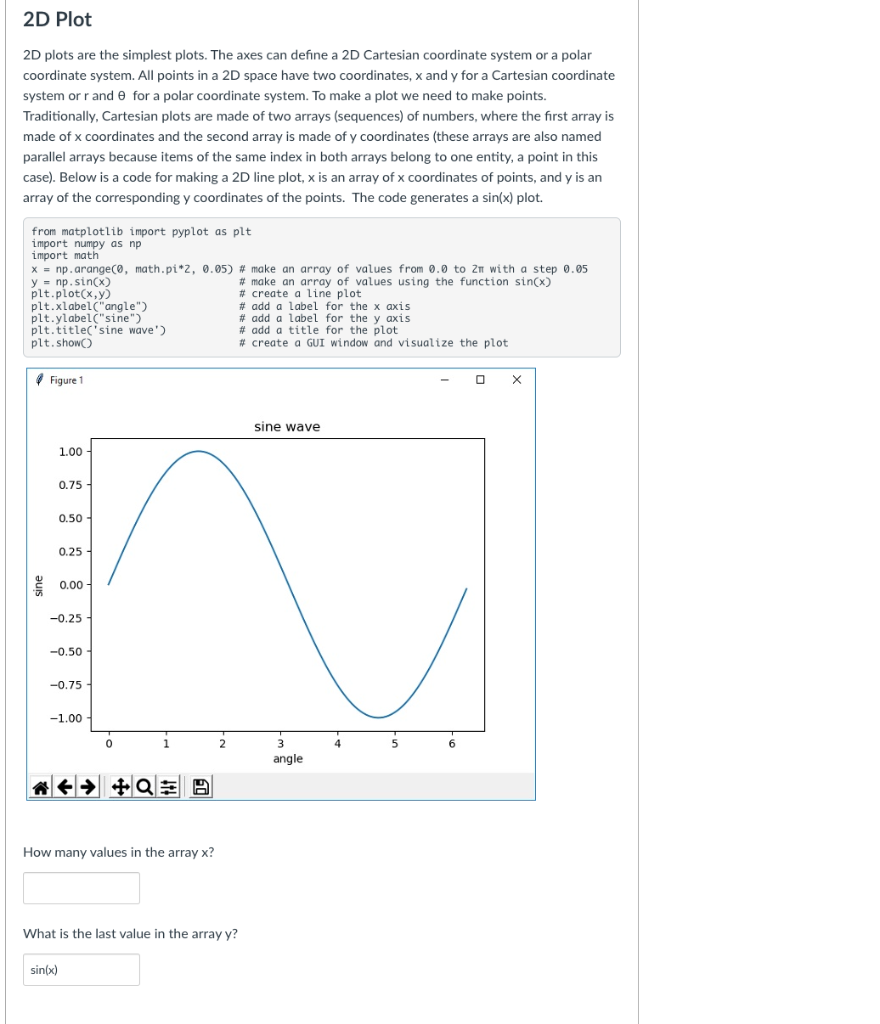
2D Plot 2D plots are the simplest plots. The axes can define a 2D Cartesian coordinate system or a polar coordinate system. All points in a 2D space have two coordinates, \( \mathrm{x} \) and \( \mathrm{y} \) for a Cartesian coordinate system or \( r \) and \( \theta \) for a polar coordinate system. To make a plot we need to make points. Traditionally, Cartesian plots are made of two arrays (sequences) of numbers, where the first array is made of \( x \) coordinates and the second array is made of \( y \) coordinates (these arrays are also named parallel arrays because items of the same index in both arrays belong to one entity, a point in this case). Below is a code for making a 2D line plot, \( x \) is an array of \( x \) coordinates of points, and \( y \) is an array of the corresponding \( y \) coordinates of the points. The code generates a \( \sin (x) \) plot. Figure 1 How many values in the array \( x \) ? What is the last value in the array \( y \) ?
