Home /
Expert Answers /
Statistics and Probability /
24-solve-the-problem-the-bar-graph-shows-the-political-affiliation-of-1000-registered-u-s-voter-pa990
(Solved): 24. Solve the problem. The bar graph shows the political affiliation of 1000 registered U.S. voter ...
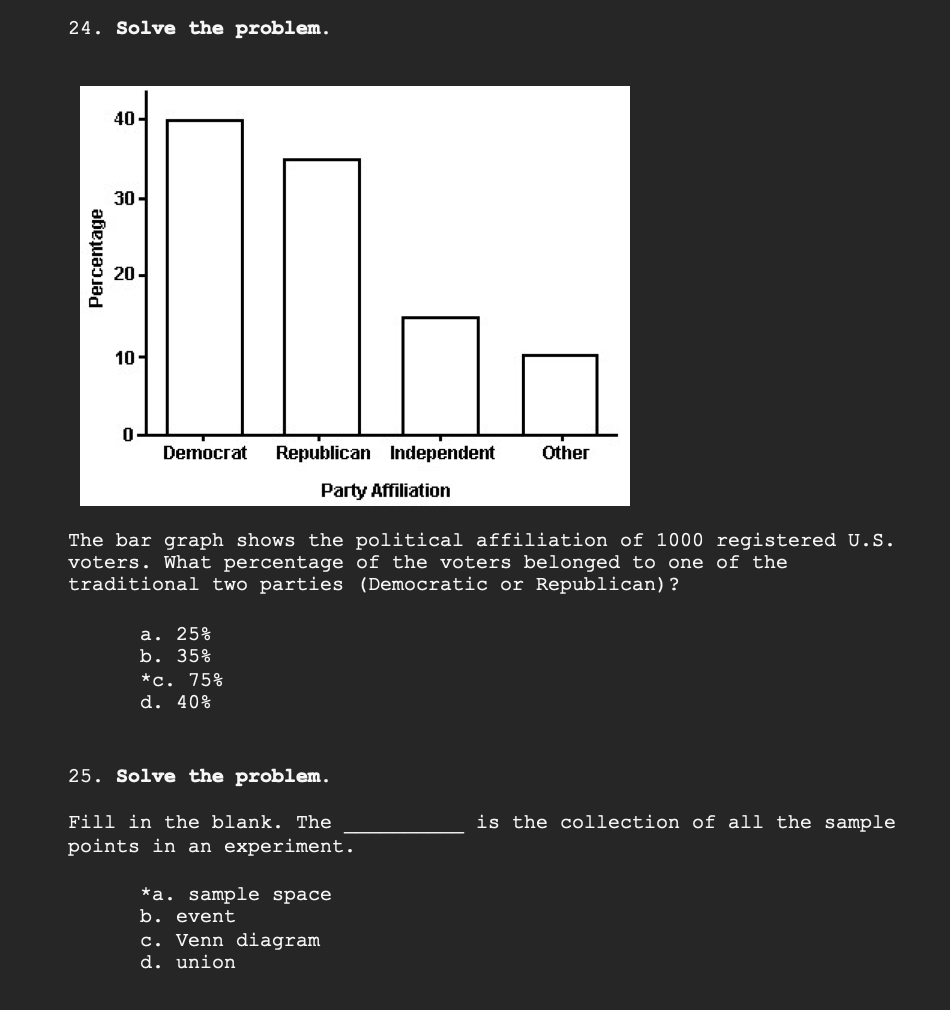
24. Solve the problem. The bar graph shows the political affiliation of 1000 registered U.S. voters. What percentage of the voters belonged to one of the traditional two parties (Democratic or Republican)? a. \( 25 \% \) b. \( 35 \% \) * C. \( 75 \% \) d. \( 40 \% \) 25. Solve the problem. Fill in the blank. The is the collection of all the sample points in an experiment. *a. sample space b. event c. Venn diagram d. union
Expert Answer
Question 24) Percentage of the voters belonged to one of the traditional t